In the previous post, we discussed Microsoft’s Graph RAG implementation. In this post, we will take a look at token consumption to query the knowledge graph, both for local and global queries.
Note: this test was performed with gpt-4o. A few days after this blog post, OpenAI released gpt-4o-mini. Initital tests with gpt-4o-mini show that index creation and querying work well with a significantly lower cost. You can replace gpt-4o with gpt-4o-mini in the setup below.
Setting up Langfuse logging
To make it easy to see the calls to the LLM, I used the following components:
LiteLLM: configured as a proxy; we configure Graph RAG to use this proxy instead of talking to OpenAI or Azure OpenAI directly; see https://www.litellm.ai/
Langfuse: an LLM engineering platform that can be used to trace LLM calls; see https://langfuse.com/
You can obtain the values from both the OpenAI and Langfuse portals. Ensure you also install Langfuse with pip install langfuse.
Next, we can start the proxy with litellm --config config.yaml --debug.
To make Graph RAG work with the proxy, open Graph RAG’s settings.yaml and set the following value under the llm settings:
api_base: http://localhost:4000
LiteLLM is listening for incoming OpenAI requests on that port.
Running a local query
A local query creates an embedding of your question and finds related entities in the knowledge graph by doing a similarity search first. The embeddings are stored in LanceDB during indexing. Basically, the results of the similarity search are used as entrypoints into the graph.
That is the reason that you need to add the embedding model to LiteLLM’s config.yaml. Global queries do not require this setting.
After the similar entities have been found in LanceDB, they are put in a prompt to answer your original question together with related entities.
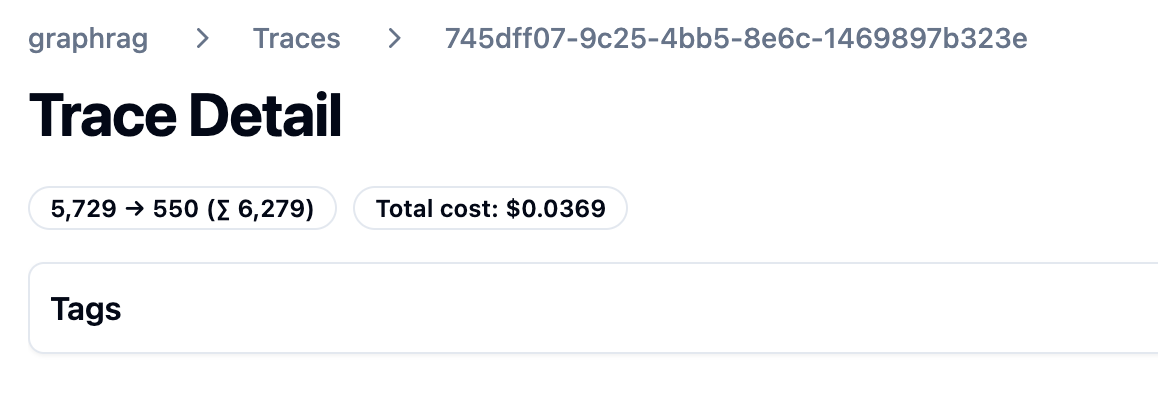
A local query can be handled with a single LLM call. Let’s look at the trace:
Trace from local query
The query took about 10 seconds and 11500 tokens. The system prompt starts as follows:
First part of local query system prompt
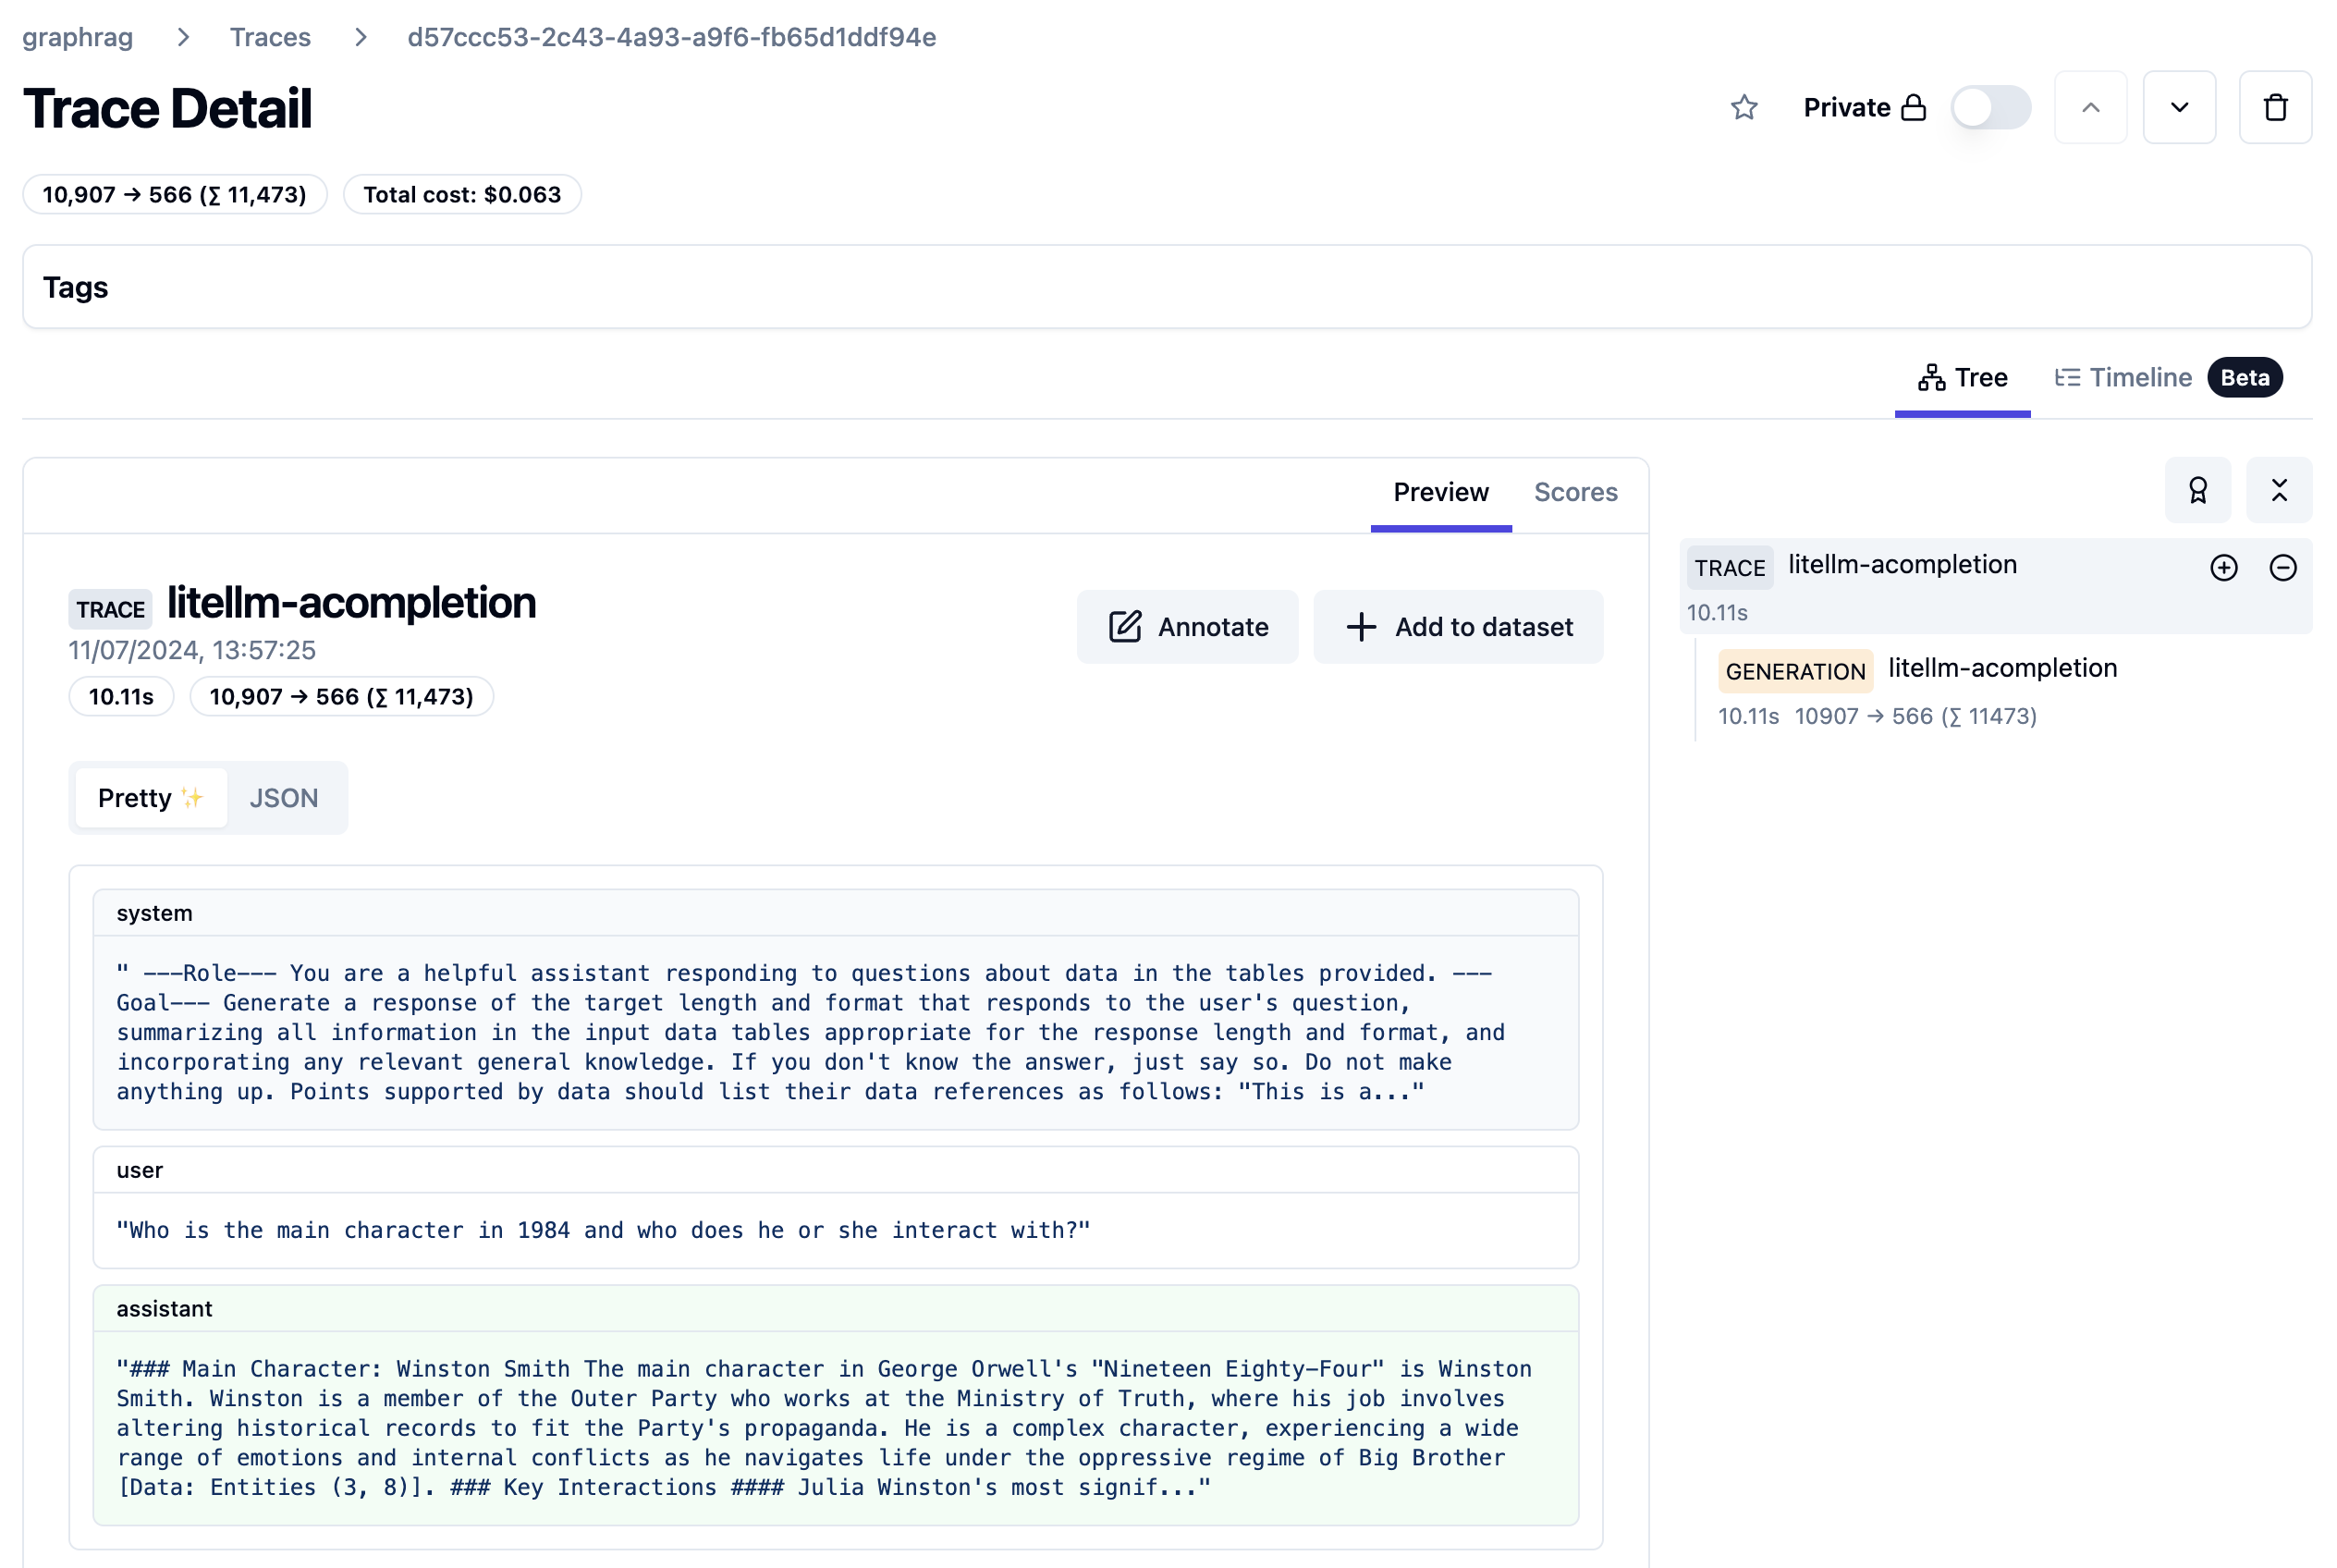
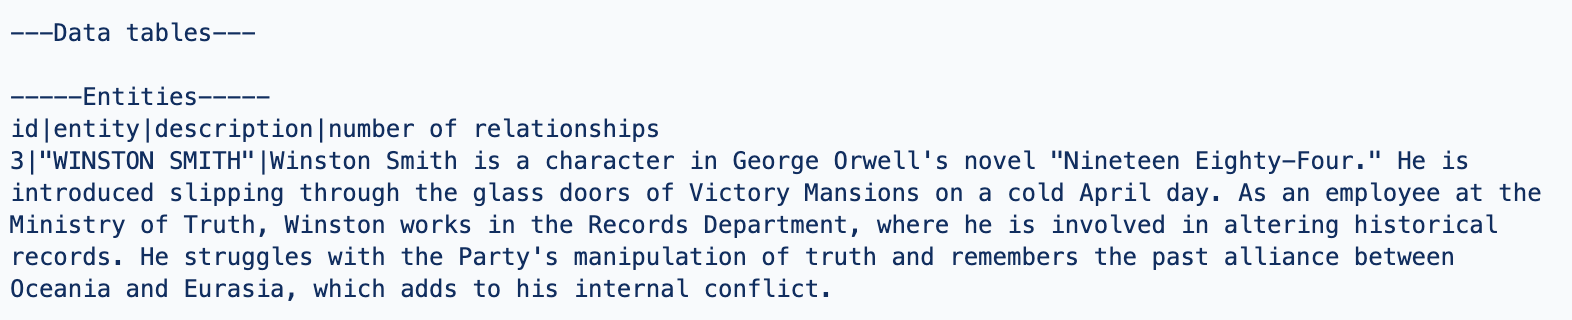
The actual data it works with (called data tables) are listed further in the prompt. You can find a few data points below:
Entity about Winston Smith, a character in the book 1984 (just a part of the text)Entity for O’Brien, a character he interacts with
The prompt also contains sources from the book where the entities are mentioned. For example:
Relevant sources
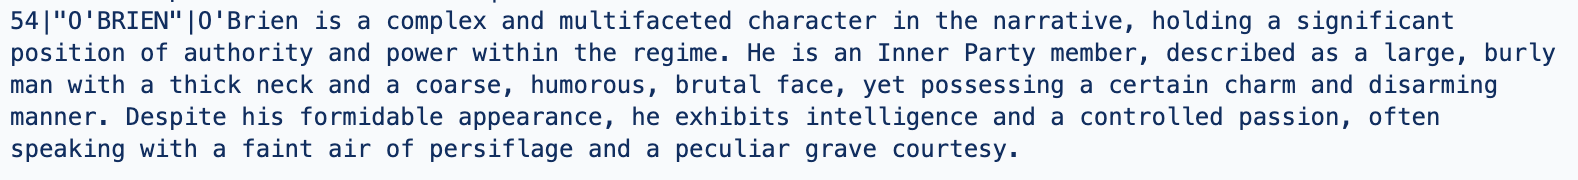
The response to this prompt is something like the response below:
LLM response to local query
The response contains references to both the entities and sources with their ids.
Note that you can influence the number of entities retrieved and the number of consumed tokens. In Graph RAG’s settings.yaml, I modified the local search settings as follows:
The trace results are clear: token consumption is lower and the latency is lower as well.
Lower token cost
Of course, there will be a bit less detail in the answer. You will have to experiment with these values to see what works best in your scenario.
Global Queries
Global queries are great for broad questions about your dataset. For example: “What are the top themes in 1984?”. A global query is not a single LLM call and is more expensive than a local query.
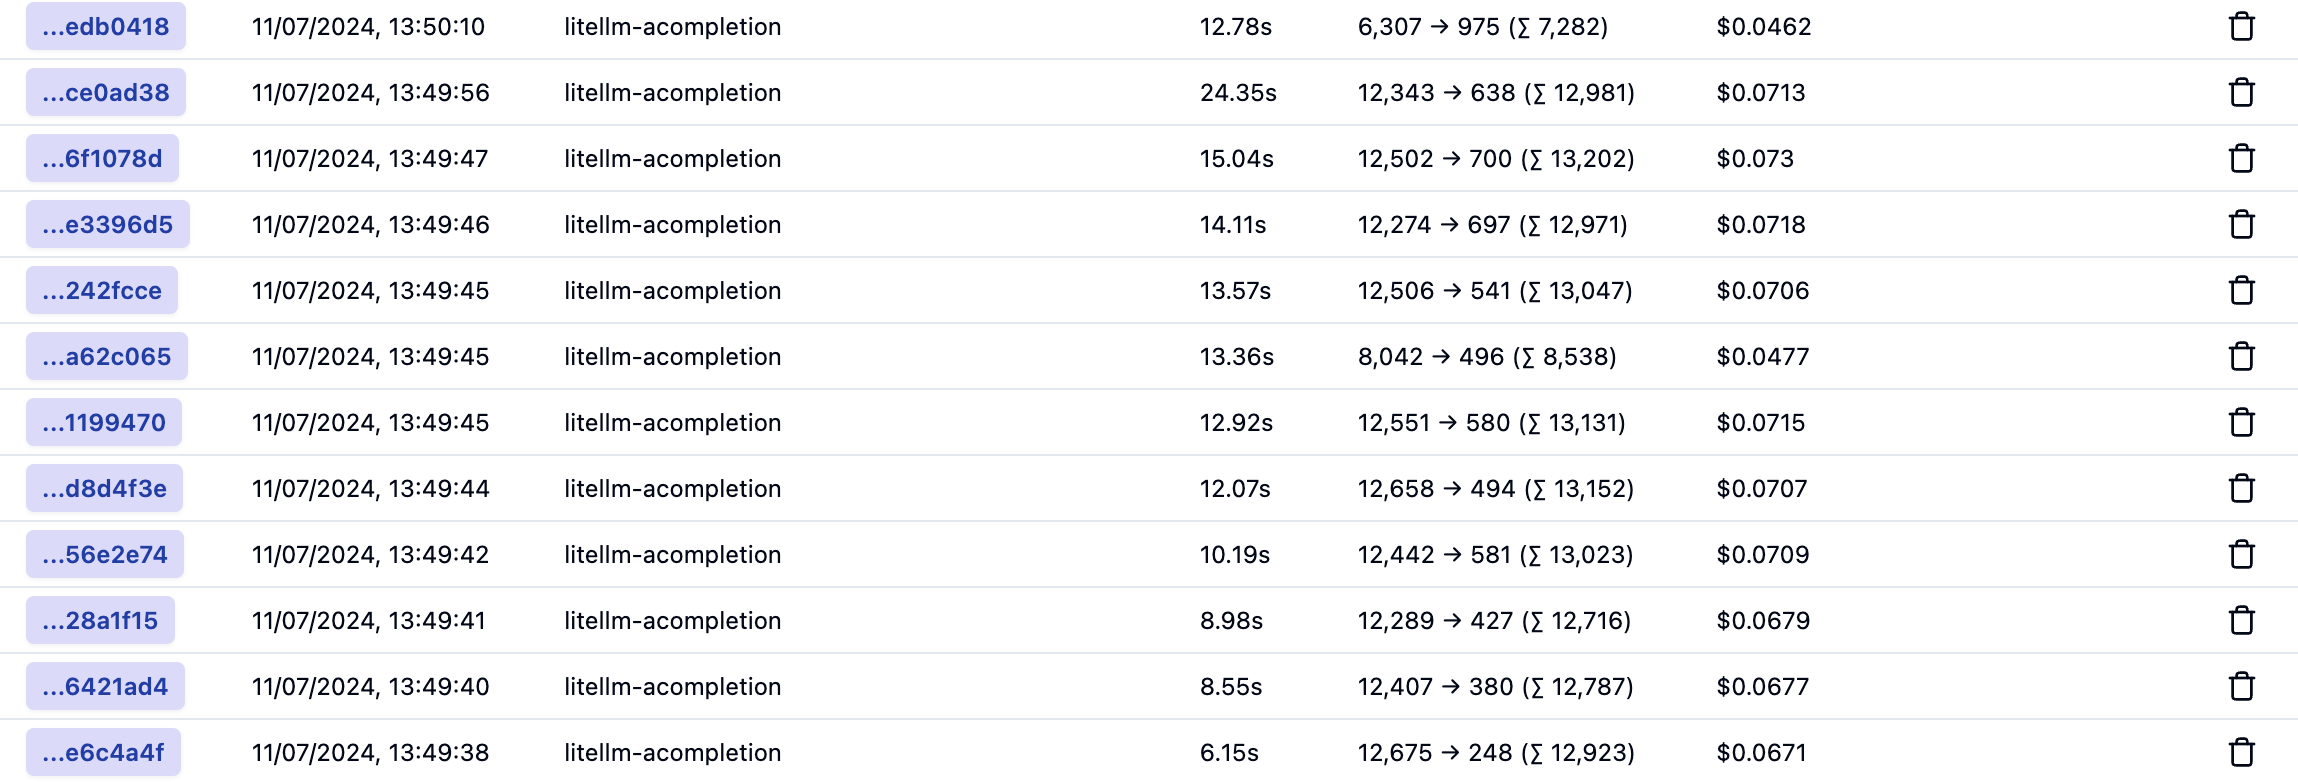
Let’s take a look at the traces for a global query. Every trace is an LLM call to answer the global query:
Traces for a global query
The last one in the list is where it starts:
First call of many to answer a global query
As you can probably tell, the call above is not returned directly to the user. The system prompt does not contain entities from the graph but community reports. Community reports are created during indexing. First, communities are detected using the Leiden algorithm and then summarized. You can have many communities and summaries in the dataset.
This first trace asks the LLM to answer the question: “What are the top themes in 1984?” to a first set of community reports and generates intermediate answers. These intermediate answers are saved until a last call used to answer the question based on all the intermediate answers. It is entirely possible that community reports are used that are not relevant to the query.
Here is that last call:
Answer the question based on the intermediate answers
I am not showing the whole prompt here. Above, you see the data that is fed to the final prompt: the intermediate answers from the community reports. This then results in the final answer:
Final answer to the global query
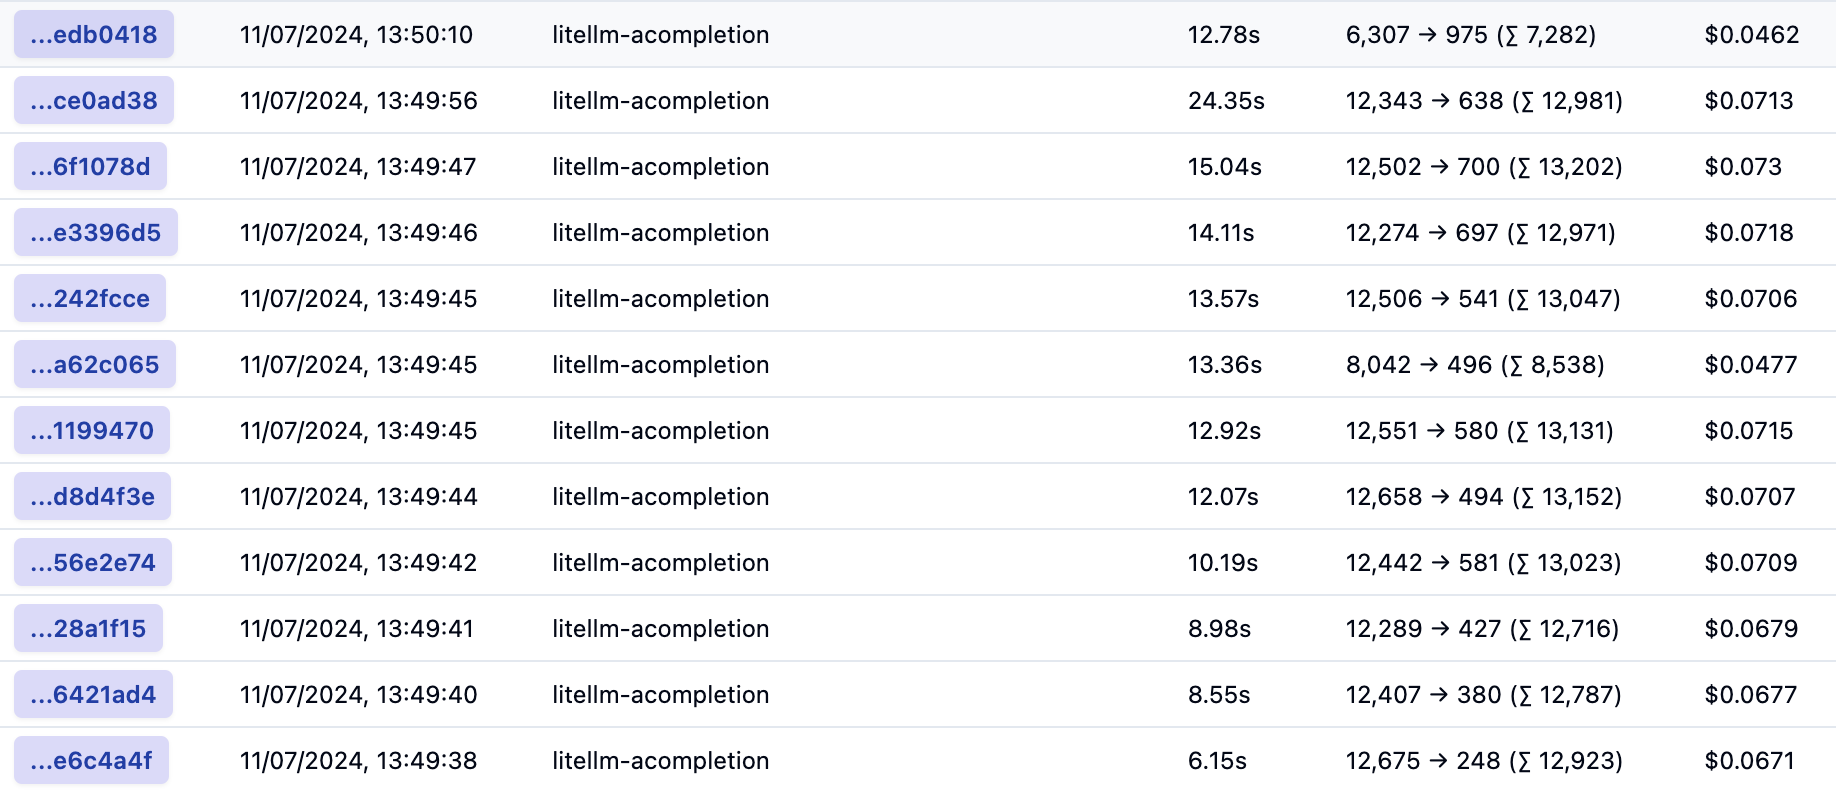
Below is the list with all calls again:
All calls to answer a global query
In total, and based on default settings, 12 LLM calls were made consuming around 150K tokens. The total latency cannot be calculated from this list because the calls are made in parallel. That total cost is around 80 cents.
The number of calls and token cost can be reduced by tweaking the default parameters in settings.yaml. For example, I made the following changes:
global_search:
  max_tokens: 6000 # was 12000
  data_max_tokens: 500 # was 1000
  map_max_tokens: 500 # was 1000
  # reduce_max_tokens: 2000
  # concurrency: 32
However, this resulted in more calls with around 140K tokens. Not a big reduction. I tried setting lower values but then I got Python errors and many more LLM calls due to retries. I would need to dig into that further to explain why this happens.
Conclusion
From the above, it is clear that local queries are less intensive and costly than global queries. By tweaking the local query settings, you can get pretty close to the baseline RAG cost where you return 3-5 chunks of text of about 500 tokens each. Latency is pretty good as well. Of course, depending on your data, it’s not guaranteed that the responses of local search will be better that baseline RAG.
Global queries are more costly but do allow you to ask broad questions about your dataset. I would not use these global queries in a chat assistant scenario consistently. However, you could start with a global query and then process follow-up questions with a local query or baseline RAG.
In a previous post, I discussed the Microsoft Bot Framework SDK that provides a fast track to deploying intelligent bots with the help of the Assistants API. Yet, the journey doesn’t stop there. Copilot Studio, a low-code tool, introduces an even more efficient approach, eliminating the need for intricate bot coding. It empowers developers to quickly design and deploy bots, focusing on functionality over coding complexities.
In this post, we will combine Copilot Studio with the Assistants API. But first, let’s take a quick look at the basics of Copilot Studio.
Copilot Studio
Copilot Studio, known before as Power Virtual Agents, is part of Microsoft’s Power Platform. It allows anyone to create a bot fast with it’s intent-based authoring experience. To try it out, just click the Try Free button on the Copilot Studio web page.
Note: I will not go into licensing here. I do not have a Phd in Power Platform Licensing yet! 😉
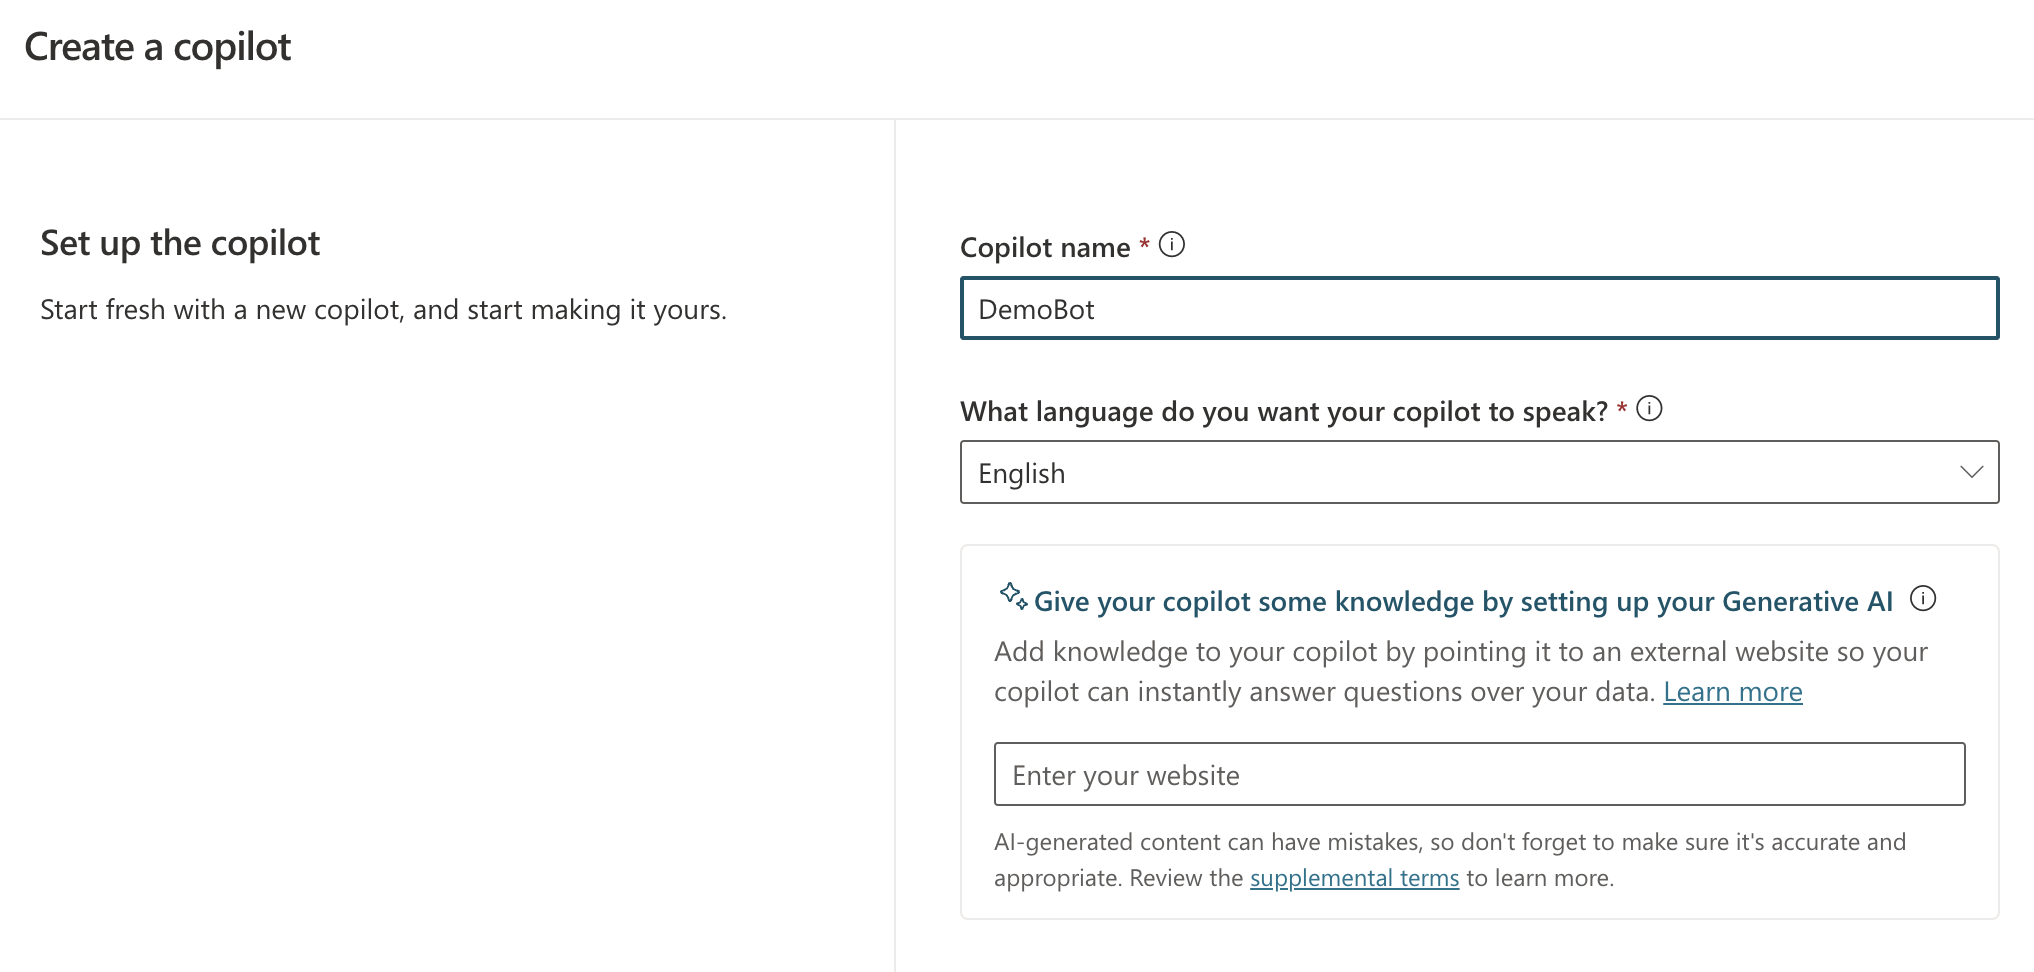
When you create a new bot, you will get the screen below:
New bot creation screen
You simply give your bot a name and a language. Right from the start, you can add Generative AI capabilities by providing a website URL. If that website is searchable by Bing, users can ask questions about content on that website.
However, this does not mean Copilot Studio can carry a conversation like ChatGPT. It simply means that, when Copilot Studio cannot identify an intent, it will search the website for answers and provide the answer to you. You can ask follow-up questions but it’s not a full ChatGPT experience. For example, you cannot say “Answer the following questions in bullet style” and expect the bot to remember that. It will simply throw an error and try to escalate you to a live agent after three tries.
Note: this error & escalate mechanism is a default; you can change that if you wish
So what is an intent? If you look at the screenshot below, you will see some out of the box topics available to your bot.
Topics and Plugins screen
Above, you see a list of topics and plugins. I have not created any plugins so there are only topics: regular topics and system topics. Whenever you send a message, the system tries to find out what your intent is by checking matching phrases defined in a trigger.
If you click on the Greeting topic, you will see the following:
Greeting topic (click to enlarge)
This topic is triggered by a number of phrases. When the user sends a message like Hi!, that message will match the trigger phrases (intent is known). A response message will be sent back: “Hello, how can I help you today?”.
It’s important to realise that no LLM (large language model) is involved here. Other machine learning stuff is at play here.
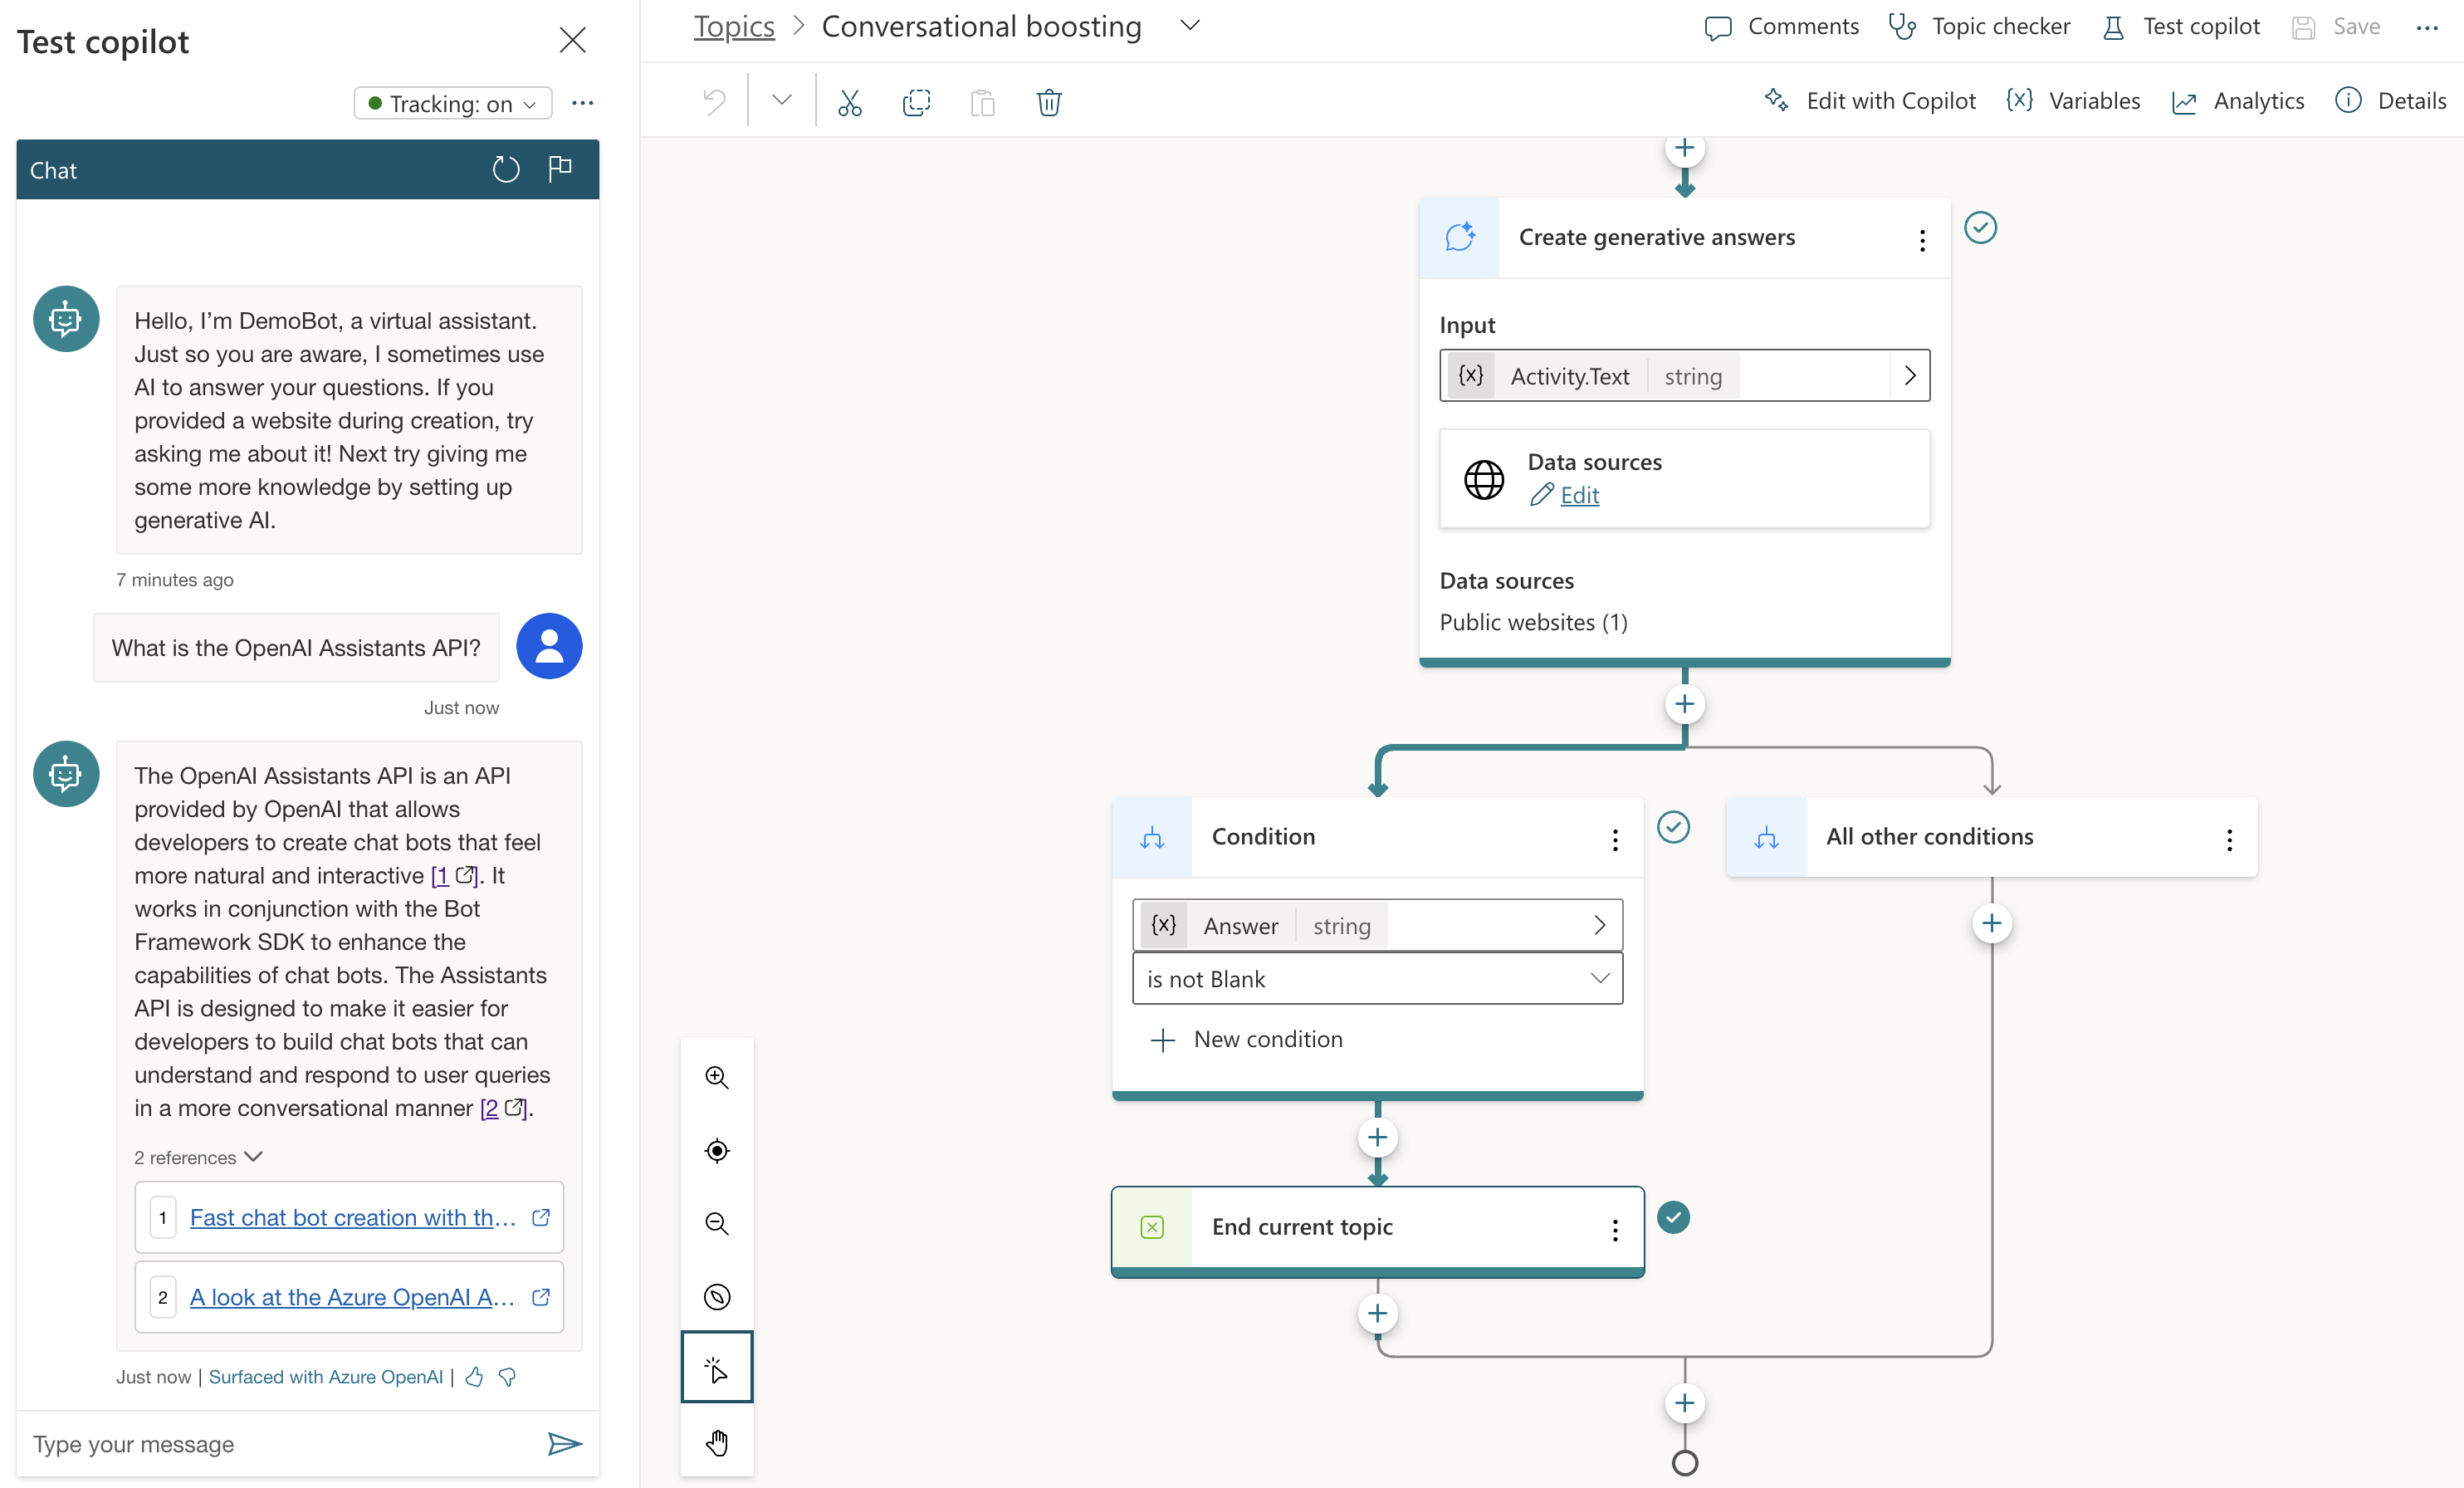
The behaviour is different when I send a message that is not matched to any of the topics. Because I setup the bot with my website (https://atomic-temporary-16150886.wpcomstaging.com), the following happens when I ask: “What is the OpenAI Assistants API?”
Check the topic above. We are in the Conversational Boosting topic now. It was automatically created when I added my website in the Generative Answers section during creation:
Boosting topic triggered when intent in not knowsn
If you look closely, you will notice that the trigger is set to On Unknown Intent. This means that this topic is used whenever you type something that cannot be matched to other topics. Behind the scenes, the system searches the website and returns a summary of the search to you, totally driven by Azure OpenAI. You do not need an Azure OpenAI resource to enable this.
This mixing and matching of intents is interesting in several ways:
you can catch specific intents and answer accordingly without using an OpenAI model: for example, when a user wants to book a business trip, you can present a form which will trigger an API that talks to an internal booking system
to answer from larger knowledge bases, you can add either use a catch-all such as the Conversational Boosting topic or even use custom intents that use the Create Generative Answers node to go to any supported data source
Besides web sites, other data sources are supported such as SharePoint, custom documents or even Azure OpenAI Add your data.
What we want to do is different. We want to use Copilot Studio to provide a full ChatGPT experience. We will not need Generative Answers to do so. Instead, we will use the OpenAI Assistants API behind the scenes.
Copilot Studio and Azure OpenAI Assistants
We want to achieve the following:
When a new conversation is started: create a new tread
When the user sends a message: add the message to the thread, run the thread and send the response back to Copilot Studio.
When the user asks to start over, start a new conversation which starts a new thread
One way of doing this, is to write a small API that can create a thread and add messages to it. Here’s the API I wrote using Python FastAPI:
from fastapi import FastAPI, Depends, HTTPException, status
from fastapi.security.api_key import APIKeyHeader, APIKey
from pydantic import BaseModel
import logging
import uvicorn
from openai import AzureOpenAI
from dotenv import load_dotenv
import os
import time
import json

load_dotenv("../.env")

# Configure logging
logging.basicConfig(level=logging.INFO)
logger = logging.getLogger(__name__)

# Define API key header; set it in ../.env
API_KEY = os.getenv("API_KEY")

# Check for API key
if API_KEY is None:
    raise ValueError("API_KEY environment variable not set")

API_KEY_NAME = "access_token"
api_key_header = APIKeyHeader(name=API_KEY_NAME, auto_error=True)

async def get_api_key(api_key_header: str = Depends(api_key_header)):
    if api_key_header == API_KEY:
        return api_key_header
    else:
        raise HTTPException(
            status_code=status.HTTP_403_FORBIDDEN, detail="Could not validate credentials"
        )

app = FastAPI()

# Pydantic models
class MessageRequest(BaseModel):
    message: str
    thread_id: str

class MessageResponse(BaseModel):
    message: str

class ThreadResponse(BaseModel):
    thread_id: str

# set the env vars below in ../.env
client = AzureOpenAI(
    api_key=os.getenv('AZURE_OPENAI_API_KEY'),
    azure_endpoint=os.getenv('AZURE_OPENAI_ENDPOINT'),
    api_version=os.getenv('AZURE_OPENAI_API_VERSION')
)

# this refers to an assistant without functions
assistant_id = "asst_fRWdahKY1vWamWODyKnwtXxj"

def wait_for_run(run, thread_id):
    while run.status == 'queued' or run.status == 'in_progress':
        run = client.beta.threads.runs.retrieve(
                thread_id=thread_id,
                run_id=run.id
        )
        time.sleep(0.5)

    return run

# Example endpoint using different models for request and response
@app.post("/message/", response_model=MessageResponse)
async def message(item: MessageRequest, api_key: APIKey = Depends(get_api_key)):
    logger.info(f"Message received: {item.message}")

    # Send message to assistant
    message = client.beta.threads.messages.create(
        thread_id=item.thread_id,
        role="user",
        content=item.message
    )

    run = client.beta.threads.runs.create(
        thread_id=item.thread_id,
        assistant_id=assistant_id # use the assistant id defined aboe
    )

    run = wait_for_run(run, item.thread_id)

    if run.status == 'completed':
        messages = client.beta.threads.messages.list(limit=1, thread_id=item.thread_id)
        messages_json = json.loads(messages.model_dump_json())
        message_content = messages_json['data'][0]['content']
        text = message_content[0].get('text', {}).get('value')
        return MessageResponse(message=text)
    else:
        return MessageResponse(message="Assistant reported an error.")


@app.post("/thread/", response_model=ThreadResponse)
async def thread(api_key: APIKey = Depends(get_api_key)):
    thread = client.beta.threads.create()
    logger.info(f"Thread created with ID: {thread.id}")
    return ThreadResponse(thread_id=thread.id)

# Uvicorn startup
if __name__ == "__main__":
    uvicorn.run(app, host="127.0.0.1", port=8324)
I am using an assistant I created in the Azure OpenAI Assistant Playground and reference it by its ID; this assistant does not use any tools or files
I require an API key via a custom HTTP header access_token; later Copilot Studio will need this key to authenticate to the API
I define two methods: /thread and /message
If you have followed the other posts about the Assistants API, the code should be somewhat self-explanatory. The code focuses on the basics so not a lot of error checking for robustness.
If you run the above code, you can use a .http file in Visual Studio Code to test it. This requires the REST Client extension. Here’s the file:
POST http://127.0.0.1:8324/message
Content-Type: application/json
access_token: 12345678

{
    "message": "How does Copilot Studio work?",
    "thread_id": "thread_S2mwvse5Zycp6BOXNyrUdlaK"
}

###

POST http://127.0.0.1:8324/thread
Content-Type: application/json
access_token: 12345678
In VS Code, with the extension loaded, you will see Send Request links above the POST commands. Click them to execute the requests. Click the thread request first and use the thread ID from the response in the body of the message request.
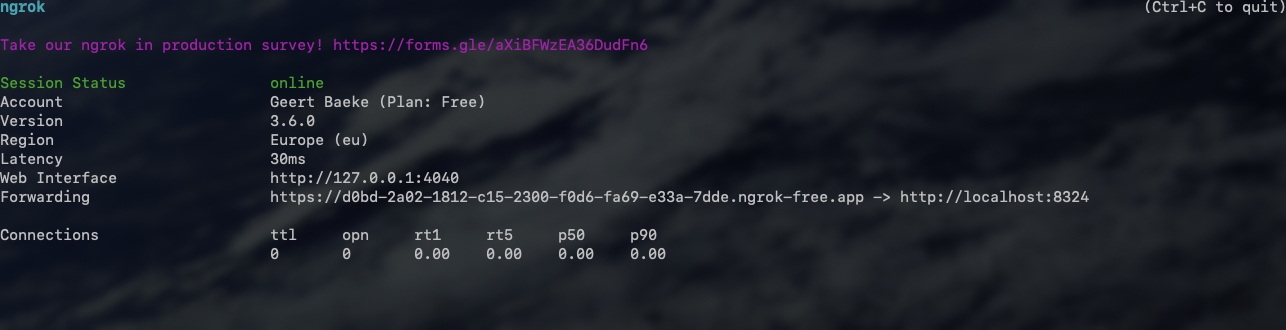
After you verified that it works, we can expose the API to the outside world with ngrok.
Using ngrok
If you have never used ngrok, download it for your platform. You should also get an authtoken by signing up and providing it to ngrok.
When the API is running, in a terminal window, type ngrok http 8324. You should see something like:
ngrok running
Check the forwarding URL. This is a public URL you can use. We will use this URL from Copilot Studio.
Note: in reality, we would publish this API to container apps or another hosting platform
Using the API from Copilot Studio
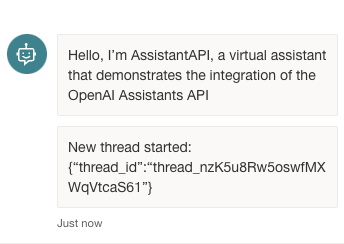
In Copilot Studio, I created a new bot without generative answers. The first thing we need to do is to create a thread when a new conversation starts:
In the UI, it looks like below:
Welcoming the user and starting a new thread
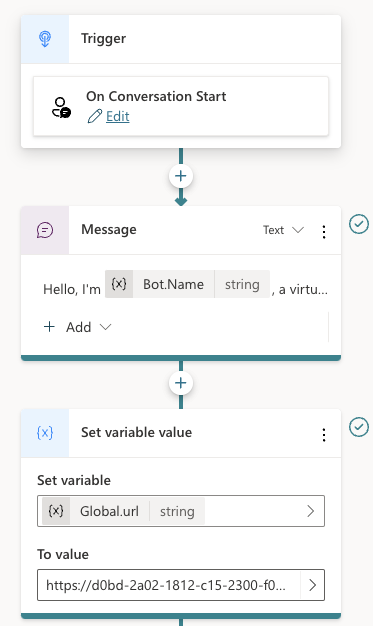
You can use the Conversation Start system topic to create the thread. The first section of the topic looks like below:
Starting a new conversation
Above there are three nodes:
Trigger node: On Conversation Start
Message: welcoming the user
Set variable: a global variable is set that’s available to all topics; the variable holds the URL of the API to call; that is the ngrok public url in this case
Below the set variable node, there are two other nodes:
Two last nodes of the Conversation Start topic
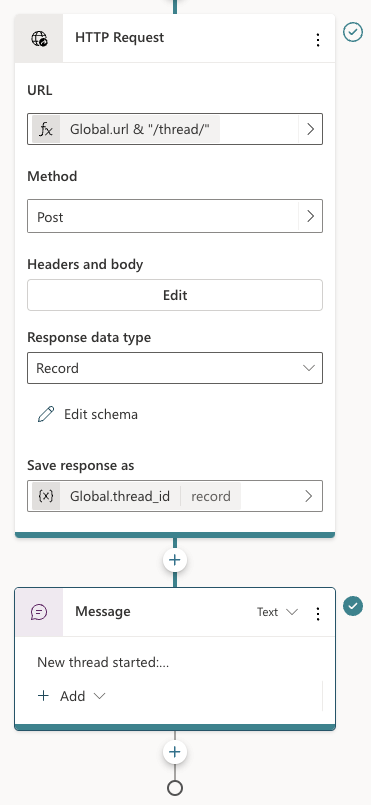
The HTTP Request node, unsurprisingly, can do HTTP requests. This is a built-in node in Copilot Studio. We call the /thread endpoint via the URL, which is the global url + “/thread” appended. The method is POST. In Headers and Body, you need to set the access_token header to the API key that matches the one from the code. There is no body to send here. When the request is successful, we save the thread ID to another global variable, global.thread_id. We need that variable is the /message calls later. The variable is of type record and holds the full JSON response from the /thread endpoint.
To finish the topic, we tell the user a new thread has started.
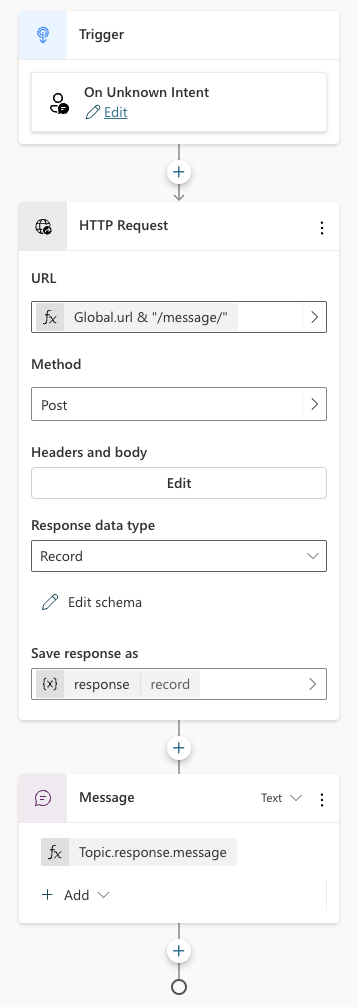
Now that we have a thread, how do we add a message to the thread? In the System Topics, I renamed the Fallback topic to Main intent. It is triggered when the intent is unknown, similar to how generative answers are used by default:
Fallback topic renamed to Main Intent
The topic is similar to the previous one:
Main intent topic
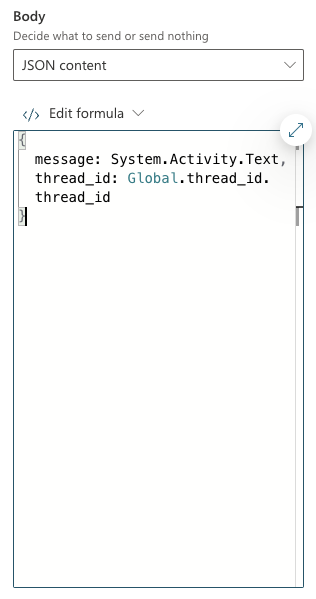
Above, HTTP Request is used again, this time to call the /message endpoint. This time Headers and Body needs some more information. In addition to the access_token header, the request requires a JSON body:
/message request body
The API expects JSON with two fields:
message: we capture what the user typed via System.Activity.Text
thread_id: stored in Global.thread_id.thread_id. The Global.thread_id variable is of type record (result from the /thread call) and contains a thread_id value. Great naming by yours truly here!
The last node in the topic simply takes the response record from the HTTP Request and sends the message field from that record back to the chat user.
You can now verify if the chat bot works from the Chat pane:
Testing the bot
You can carry on a conversation with the assistant virtually indefinitely. As mentioned in previous posts, the assistants API tries to use up the model’s context window and only starts to trim messages from the thread when the context limit is reached.
If your assistant has tools and function calling, it’s possible it sends back images. The API does not account for that. Only text responses are retrieved.
Note: the API and bot configuration is just the bare minimum to get this to work; there is more work to do to make this fully functional, like showing image responses etc…
Adding a Teams channel
Copilot Studio bots can easily by tied to a channel. One of those channels is Teams. You can also do that with the Bot Framework SDK if you combine it with an Azure Bot resource. But it is easier with Copilot Studio.
Before you enable a channel, ensure your bot is published. Go to Publish (left pane) and click the Publish button.
Note: whenever you start a new ngrok session and update the URL in the bot, publish the bot again
Next, go to Settings and then Channels. I enabled the Teams channel:
Teams channel enabled
In the right pane, there’s a link to open the bot directly in Teams. It could be that does not work in your organisation but it does in mine:
Our Copilot Studio assistant in Teams
Note that it might be needed to restart the conversation if there is something wrong. By default, the chat bot has a Start Over topic. I modified that topic to redirect to Conversation Start. That results in the creation of a new thread:
Redirect to Conversation Start when user types start over or similar phrases
The user can simple type something like Start Over. The bot would respond as follows:
Starting over
Conclusion
If you want to use a low-code solution to build the front-end of an Azure OpenAI Assistant, using Copilot Studio in conjunction with the Assistants API is one way of achieving that.
Today, it does require some “pro-code” as the glue between both systems. I can foresee a future with tighter integration where this is just some UI configuration. I don’t know if the teams are working on this, but I surely would like to see it.
In all of those posts, we demonstrated the abilities of the Azure OpenAI Assistants API in a Python notebook. In this post, we will build an actual chat application with some help of the Bot Framework SDK.
The Bot Framework SDK is a collection of libraries and tools that let you build, test and deploy bot applications. The target audience is developers. They can write the bot in C#, TypeScript or Python. If you are more of a Power Platform user/developer, you can also use Copilot Studio. I will look at the Assistants API and Copilot Studio in a later post.
The end result after reading this post is a bot you can test with the Bot Framework Emulator. You can download the emulator for your platform here.
When you run the sample code from GitHub and connect the emulator to the bot running on you local machine, you get something like below:
Bot with answers provided by Assistants API
Writing a basic bot
You can follow the Create a basic botquickstart on Microsoft Learn to get started. It’s a good quickstart and it is easy to follow.
On that page, switch to Python and simply follow the instructions. The end-to-end sample I provide is in Python so using that language will make things easier. At the end of the quickstart, you will have a bot you can start with python app.py. The post also tells you how to connect the Bot Framework Emulator to your bot that runs locally on your machine. The quickstart bot is an echo bot that simply echoes the text you type:
Echo bot in action… oooh exciting 😀
A quick look at the bot code
If you check the bot code in bot.py, you will see two functions:
on_members_added_activity: do something when a new chat starts; we can use this to start a new assistant thread
on_message_activity: react to a user sending a message; here, we can add the message to a thread, run it, and send the response back to the user
👉 This code uses a tiny fraction of features of the Bot Framework SDK. There’s a huge list of capabilities. Check the How-To for developers, which starts with the basics of sending and receiving messages.
Below is a diagram of the chat and assistant flow:
Assistant Flow
In the diagram, the initial connection triggers on_members_added_activity. Let’s take a look at it:
async def on_members_added_activity(
        self,
        members_added: ChannelAccount,
        turn_context: TurnContext
    ):
        for member_added in members_added:
            if member_added.id != turn_context.activity.recipient.id:
                # Create a new thread
                self.thread_id = assistant.create_thread()
                await turn_context.send_activity("Hello. Thread id is: " + self.thread_id)
The function was modified to create a thread and store the thread.id as a property thread_id of the MyBot class. The function create_thread() comes from a module called assistant.py, which I added to the folder that contains bot.py:
The second function, on_message_activity, is used to respond to new chat messages. That’s number 2 in the diagram above.
async def on_message_activity(self, turn_context: TurnContext):
        # add message to thread
        run = assistant.send_message(self.thread_id, turn_context.activity.text)
        if run is None:
            print("Result of send_message is None")
        tool_check = assistant.check_for_tools(run, self.thread_id)
        if tool_check:
            print("Tools ran...")
        else:
            print("No tools ran...")
        message = assistant.return_message(self.thread_id)
        await turn_context.send_activity(message)
Here, we use a few helper methods. It could actually be one function but I decided to break them up somewhat:
send_message: add a message to the thread created earlier; we grab the text the user entered in the chat via turn_context.activity.text
check_for_tools: check if we need to run a tool (function) like hr_search or request_raise and add tool results to the messages
return_message: return the last message from the messages array and send it back to the chat via turn_context.send_activity; that’s number 5 in the diagram
💡 The stateful nature of the Azure OpenAI Assistants API is of great help here. Without it, we would need to use the Chat Completions API and find a way to manage the chat history ourselves. There are various ways to do that but not having to do that is easier!
A look at assistant.py
Check assistant.py on GitHub for the details. It contains the helper functions called from on_message_activity.
Define a helper function to query the Chroma database
If you have read the previous blog post on retrieval, you should already be familiar with all of the above.
What’s new are the assistant helper functions that get called from the bot.
create_thread: creates a thread and returns the thread id
wait_for_run: waits for a thread run to complete and returns the run; used internally; never gets called from the bot code
check_for_tools: checks a run for required_action, performs the actions by running the functions and returning the results to the assistant API; we have two functions: hr_query and request_raise.
send_message: sends a message to the assistant picked up from the bot
return_message: picks the latest message from the messages in a thread and returns it to the bot
To get started, this is relatively easy. However, building a chat bot that does exactly what you want and refuses to do what you don’t want is not particularly easy.
Should you do this?
Combining the Bot Framework SDK with OpenAI is a well-established practice. You get the advantages of building enterprise-ready bots with the excellent conversational capabilities of LLMs. At the moment, production bots use the OpenAI chat completions API. Due to the stateless nature of that API you need to maintain the chat history and send it to the API to make it aware of the conversation so far.
As already discussed, the Assistants API is stateful. That makes it very easy to send a message and get the response. The API takes care of chat history management.
As long as the Assistants API does not offer ways to control the chat history by limiting the amount of interactions or summarising the conversation, I would not use this API in production. It’s not recommended to do that anyway because it is in preview (February 2024).
However, as soon as the API is generally available and offers chat history control, using it with the Bot Framework SDK, in my opinion, is the way to go.
For now, as a workaround, you could limit the number of interactions and present a button to start a new thread if the user wants to continue. Chat history is lost at that moment but at least the user will be aware of it.
Conclusion
The OpenAI Assistants API and the Bot Framework SDK are a great match to create chat bots that feel much more natural than with the Bot Framework SDK on its own. The statefulness of the assistants API makes it easier than the chat completions API.
This post did not discuss the ability to connect Bot Framework bots with an Azure Bot Service. Doing so makes it easy to add your bot to multiple channels such as Teams, SMS, a web chat control and much more. We’ll keep that for another post. Maybe! 😀
I have talked about and demonstrated the use of kubelogin in previous posts and videos. Because I often get questions about logging on to Azure Kubernetes Services (AKS) integrated with Azure AD (AAD) in a non-interactive fashion, I decided to write this separate post about it.
What is kubelogin?
Kubelogin is a client-go credential plugin that implements Azure AD authentication. Kubernetes and its CLI, kubectl, are written in Go and client-go is a package or library that allows you to talk to Kubernetes from the Go language. Client-go supports credentials plugins to integrate with authentication protocols that are not supported by default by kubectl. Do not confuse azure/kubelogin with int128/kubelogin. The latter is a generic credential plugin that supports OpenID Connect in general, while the former was specifically created for Azure.
Why use it?
When you integrate an AKS cluster with Azure AD, you can grant users and groups in Azure AD, access rights to your cluster. You do that via Kubernetes RBAC or Azure RBAC for Kubernetes. Once you have assigned the necessary access rights to the user or group, a user can login by first obtaining credentials with the Azure CLI:
az aks get-credentials -n CLUSTERNAME -g RESOURCEGROUP
After running the above command, the user will not be asked to authenticate yet. However, when a command such as kubectl get nodes is run, the user will need to authenticate to Azure AD by opening a browser and entering a code:
Prompted to enter a code
When the code is entered, and the user has the necessary role to run the command, the output will appear.
This is great when you are working interactively on the command line but not so great in a pipeline. Often, engineers circumvent this by using:
az aks get-credentials -n CLUSTERNAME -g RESOURCEGROUP --admin
The use of –admin switches to client certificate authentication and gives you full control of the cluster. In general, this is not recommended. It is worth noting that, at the time of this writing, there is also a preview feature that can disable the use of local accounts.
What to do in a pipeline?
In a pipeline, the easiest way to login with an Azure AD account is as follows:
Use the Azure CLI and logon with an account that has the required role on the Kubernetes cluster
Use az aks get-credentials to obtain cluster credentials and DO NOT use –admin; this creates a kube config file on the CI/CD agent (e.g. GitHub runner, Azure DevOps agent, etc…)
Download kubelogin if required (mostly, that will be needed)
Use kubelogin to update the kube config file with the token of the Azure CLI user; this is one of the options and has been added in March of 2021
Check out the following sample Azure DevOps pipeline below:
trigger: none

pool:
  vmImage: ubuntu-latest

steps:
- task: KubectlInstaller@0
  inputs:
    kubectlVersion: 'latest'

- task: AzureCLI@2
  inputs:
    azureSubscription: 'NAME OF AZURE DEVOPS SERVICE CONNECTION'
    scriptType: 'bash'
    scriptLocation: 'inlineScript'
    inlineScript: |
      az aks get-credentials -n CLUSTERNAME -g CLUSTERRESOURCEGROUP

      # get kubelogin
      wget https://github.com/Azure/kubelogin/releases/download/v0.0.9/kubelogin-linux-amd64.zip
      unzip kubelogin-linux-amd64.zip
      sudo mv bin/linux_amd64/kubelogin /usr/bin
      kubelogin convert-kubeconfig -l azurecli

      kubectl get nodes
In Azure DevOps, you can specify a name of a service connection in the azureSubscription parameter of the AzureCLI@2 task. The account used by the service connection needs access rights to the Kubernetes cluster.
The command kubelogin convert-kubeconfig -l azurecli modifies the kube config obtained with az aks get-credentials with a token for the account used by the Azure CLI. To use the Azure CLI credential, you have to use managed AAD integration.
Although the above is for Azure DevOps, the process is similar for other CI/CD systems such as GitHub workflows. In GitHub, you can use the azure/CLI action, which requires an azure/login action first. The azure/login action uses a service principal to connect. That service principal needs access rights to the Kubernetes cluster.
Note that there are many other ways to obtain the token. You are not restricted to use the Azure CLI credentials. You can also use your own service principal or a managed service identity (MSI). Check the README of azure/kubelogin for more info.
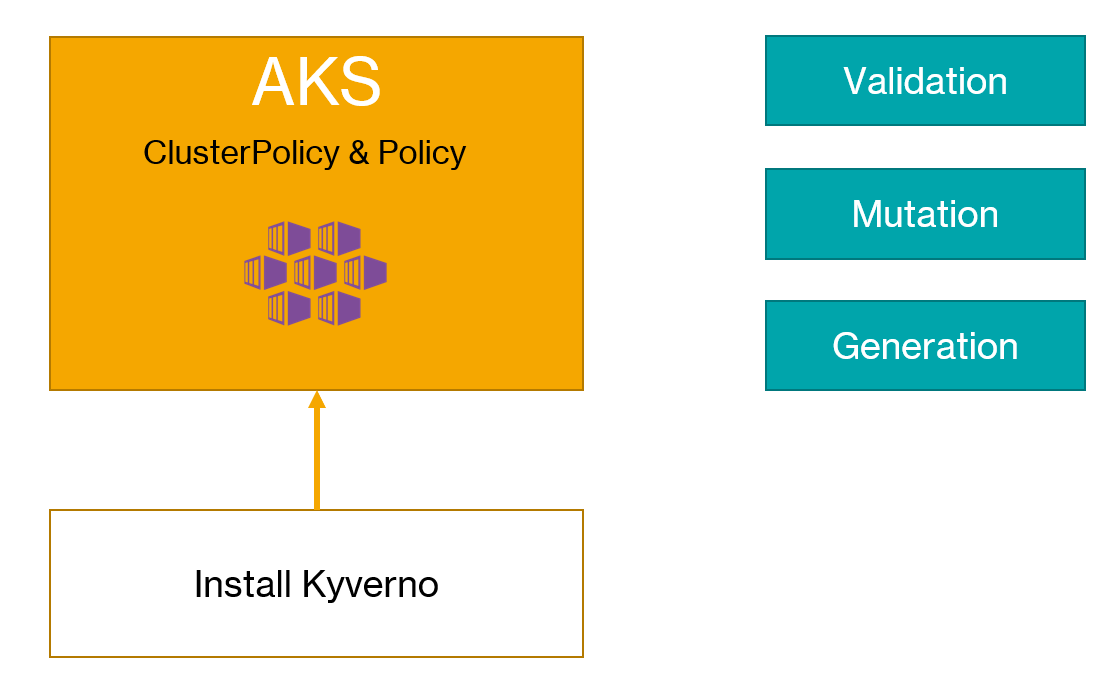
In an earlier blogpost, I wrote about Kubernetes Policies on Azure Kubernetes Service with the Azure Policy add-on. The add-on installs Gatekeeper v3 on AKS, which relies on Open Policy Agent to define your policies. Open Policy Agent is a general cloud-native solution for policy-based control, which goes beyond Kubernetes. Defining custom policies for OPA (and thus Gatekeeper), requires knowledge of rego, their policy language. Rego is very powerful and flexible but can be a bit daunting. As always, there’s a learning curve but the feedback I get is that it can be quite steep.
When you are using Azure Policy with the AKS add-on, you can only use the built-in Azure policies. If you want custom policies, you should install Gatekeeper v3 on AKS yourself and write your own ConstraintTemplates that contain the policy logic written in rego.
If you only need policies for Kubernetes and you want to express the policies in YAML, Kyverno is a good alternative. It makes it relatively easy to write validation policies. In addition to validation policies, Kyverno supports mutation and generation policies. More about that later.
Installation
Installation is very easy via a raw YAML manifest or a Helm chart. Because the Kyverno policy engine runs as an admission webhook, it requires secure communication from the Kubernetes API server. By default, the installation uses self-signed certificates.
The simplest way to install it is via the command below:
Always check the raw YAML before submitting it to your cluster! By default, the admission webhook is installed in the kyverno namespace, via a deployment that deploys 1 replica of ghcr.io/kyverno/kyverno:v1.3.5-rc2 (or whatever is in the install.yaml at the time of installation). This install.yaml always refers to the latest release, which includes release candidates. You should change the version of the image to the latest stable release in production scenarios. At the time of writing, the latest stable release was 1.3.4.
Creating policies
As discussed above, you can write three types of policies:
validation: write rules to deny the creation of resources and enforce them in realtime or audit them
mutation: patch incoming JSON requests to modify them before validation and submission to etcd
generation: creating additional objects; e.g., when you create a namespace, add roles to the namespace or add a default-deny network policy
To illustrate the creation of these types of policies, I created a video on my YouTube channel:
CI/CD Policy Check
Before you deploy workloads to Kubernetes, it is a good idea to check if your manifests pass your policy rules before you deploy. For OPA, you can do that with conftest. On GitHub Marketplace, you will find several actions that can run conftest in a workflow.
To check your manifests with Kyverno, there is the Kyverno CLI. You simply put the same policies you submit to your cluster in a folder (e.g., policies) and then run the CLI as shown below (in the folder containing the policies and deploy folders):
Above, the policies are applied to just one manifest (deployment.yaml). It works with multiple manifests as well. When there is an issue, you will see it in the output:
policy require-run-as-non-root -> resource default/Deployment/go-template-deployment failed:
1. autogen-check-containers: validation error: Running as root is not allowed. The fields spec.securityContext.runAsNonRoot, spec.containers[*].securityContext.runAsNonRoot, and spec.initContainers[*].securityContext.runAsNonRoot must be `true`. Rule autogen-check-containers[0] failed at path /spec/template/spec/containers/0/securityContext/runAsNonRoot/. Rule autogen-check-containers[1] failed at path /spec/template/spec/containers/0/securityContext/runAsNonRoot/.

pass: 14, fail: 1, warn: 0, error: 0, skip: 0
Above, kyverno apply found that my deployment has securityContext.runAsNonRoot: false set, which is not allowed.
To run this check in a GitHub workflow, I created a GitHub action that does exactly that. Apparently, such an action did not exist. Drop me a comment if there is another way. You can find the GitHub Action on the marketplace: https://github.com/marketplace/actions/kyverno-cli.
To use the action in a workflow, drop in a snippet similar to the one below:
There’s more you can do with the CLI so be sure to check out the documentation.
Conclusion
Although we only scratched the surface in this post and the above video, in my opinion Kyverno is somewhat easier to get started with than OPA Gatekeeper. Having the ability to create mutation and generation policies opens up all kinds of interesting scenarios as well. The documentation is clear and the examples are a good way to get you started. If you only need policies on Kubernetes and not the wide capabilities of OPA, give it a try and tell me what you think!
If you have ever installed Kubernetes on your own hardware or you have worked with Kubernetes on the desktop with a tool like kind, you probably know that you need a config file that tells the Kubernetes CLI (kubectl) how to talk to the Kubernetes API server. It contains the address of the API server, the cert of the CA that issued the API Server’s SSL certificate and more. Check the docs for more information. Tools like kind make it very easy because they create the file automatically or merge connection information into an existing config file.
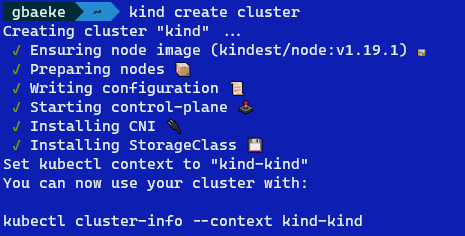
For example, when you run kind create cluster, you will see the following message at the end:
kind output
The message Set kubectl context to kind-kind indicates that the config file in $HOME/.kube was modified. If you were to check the config file, you would find a client certificate and client key to authenticate to kind. Client certificate authentication is a very common way to authenticate to Kubernetes.
Azure AD authentication
In an enterprise context, you should not rely on client certificate authentication. It would be too cumbersome to create and manage all these client certificates. The level of control over these certificates is limited as well. In a Microsoft context with users, groups and service principals (think service accounts) in Azure Active Directory, Kubernetes should be integrated with that. If you are using Azure-managed Kubernetes with AKS, that is very easy to do with AKS-managed AAD authentication. There is also a manual method of integrating with AAD but you should not use that anymore. There is still some time to move away from that method though. 😀
To illustrate how you logon with Azure AD and how to bypass AAD, I created a video on my YouTube channel:
Azure AD Authentication in a pipeline
If you watched the video, you know you need to interactively provide your credentials when you perform an action that needs to be authenticated. After providing your credentials, kubectl has an access token (JWT) to pass to the Kubernetes API server.
In a pipeline or other automated process, you want to logon non-interactively. That is possible via the client-go credentials plugin kubelogin. When you search for kubelogin, you will find several of those plugins. You will want to use Azure/kubelogin to logon to Azure AD. In the video above, I demonstrate the use of kubelogin around the 14:40 mark.
When you deploy Azure Kubernetes Service (AKS) in an enterprise context, you will probably be asked about policies that can be applied to AKS for compliance and security. In this post, we will discuss Azure Policy for Kubernetes briefly and then proceed to explaining a group of policies that implement baseline security settings.
Azure Policy for Kubernetes
To apply policies to Kubernetes, Microsoft decided to integrate their existing Azure Policy solution with Gatekeeper v3. Gatekeeper is an admission controller webhook for Open Policy Agent (OPA). An admission controller webhook is a piece of software, running in Kubernetes, that can inspect incoming requests to the Kubernetes API server and decide to either allow or deny it. Open Policy Agent is a general solution for policy based control that goes way beyond just Kubernetes. It uses a language, called rego, that allows you to write policies that allow or deny requests. You can check the gatekeeper library for examples.
Although you can install Gatekeeper v3 on Kubernetes yourself, Microsoft provides an add-on to AKS that installs Gatekeeper for you. Be aware that you either install it yourself or let the add-on do it, but not both. The AKS add-on can be installed via the Azure CLI or an ARM template. It can also be enabled via the Azure Portal:
The policy add-on can easily be enabled and disabled via the Azure Portal; above it is enabled
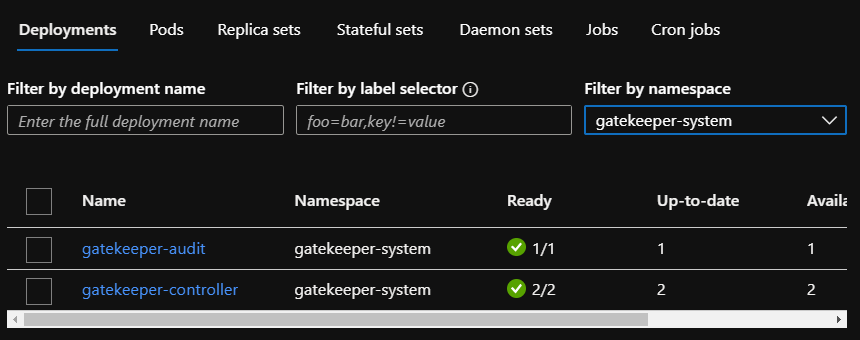
When you enable the add-on, there will be an extra namespace on your cluster called gatekeeper-system. It contains the following workloads:
Gatekeeper v3 workloads
If, for some reason, you were to remove the above deployments, the add-on would add them back.
Enabling policies
Once the add-on is installed, you can enable Kubernetes policies via Azure Policy. Before we get started, keep in mind the following:
Policies can be applied at scale to multiple clusters: Azure Policy can be attached to resource groups, a subscription or management groups. When there are multiple AKS clusters at those levels, policy can be applied to all of those clusters
Linux nodes only
You can only use built-in policies provided by Azure
That last point is an important one. Microsoft provides several policies out of the box that are written with rego as discussed earlier. However, writing your own policies with rego is not supported.
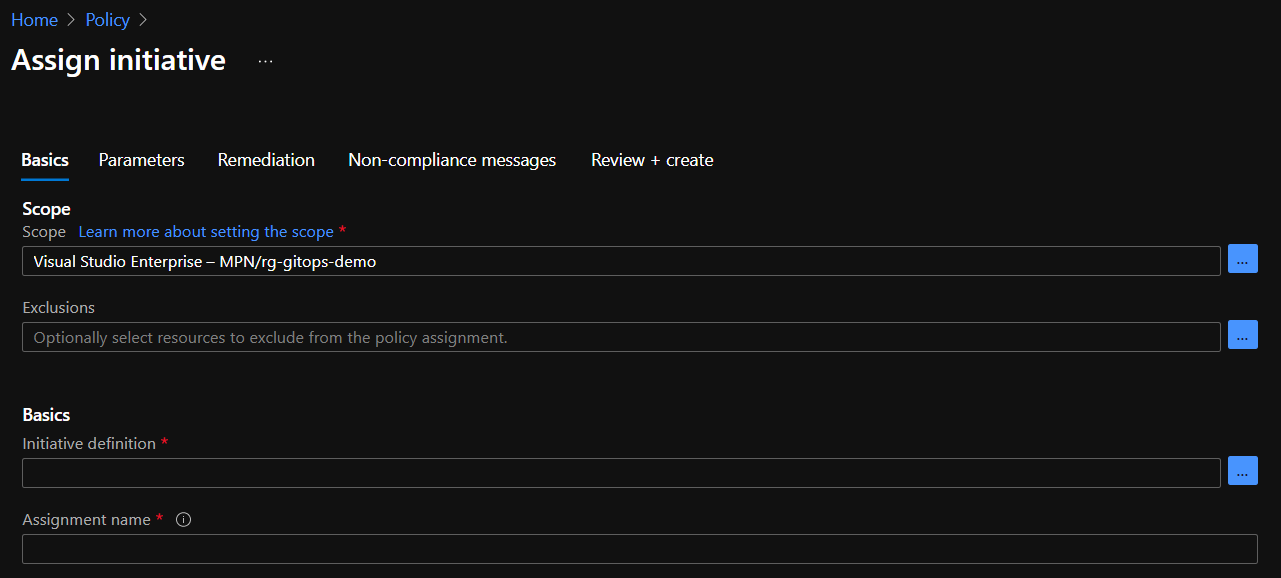
Let’s add a policy initiative, which is just a fancy name for a group of policies. We will apply the policy to the resource group that contains my AKS cluster. From Azure Policy, click assignments:
Click Assign Initiative. The following screen is shown:
Above, the imitative will be linked to the rg-gitops-demo resource group. You can change the scope to the subscription or a management group as well. Click the three dots (…) next to Basics – Initiative definition. In the Search box, type kubernetes. You should see two initiatives:
We will apply the baseline standards. The restricted standards include extra policies. Click the baseline standards and click Select. A bit lower in the screen, make sure Policy Enforcement is enabled:
Now click Next. Because we want to deny the policy in real-time, select the denyeffect:
Note that several namespaces are excluded by default. You can add namespaces here that you trust but run pods that will throw policy violations. On my cluster, there is a piece of software that will definitely cause a violation. You can now follow the wizard till the end and create the assignment. The assignment should be listed on the main Azure Policy screen:
You should now give Azure Policy some time to evaluate the policies. After a while, in the Overview screen, you can check the compliance state:
Above, you can see that the Kubernetes policies report non-compliance. In the next section, we will describe some of the policies in more detail.
Note that although these policies are set to deny, they will not kill existing workloads that violate the policy. If you were to kill a running pod that violates the policies, it will not come back up!
Important: in this article, we apply the default initiative. As a best practice however, you should duplicate the initiative. You can then change the policy parameters specific to your organization. For instance, you might want to allow host paths, allow capabilities and more. Host paths and capabilities are explained a bit more below.
Policy details
Let’s look at the non-compliant policy first, by clicking on the policy. This is what I see:
The first policy, Kubernetes cluster pod hostPath volumes should only use allowed host paths, results in non-compliance. This policy requires you to set the paths on the host that can be mapped to the pod. Because we did not specify any host paths, any pod that mounts a host path in any of the namespaces that policy applies too will generate a violation. In my case, I deployed Azure Key Vault to Kubernetes, which mounts the /etc/kubernetes/azure.json file. That file contains the AKS cluster service principal credentials! Indeed, the policy prohibits this.
To learn more about a policy, you can click it and then select View Definition. The definition in JSON will be shown. Close to the end of the JSON, you will find a link to a contraintTemplate:
When you click the link, you will find the rego behind this policy. Here is a snippet:
Even if you have never worked with rego, it’s pretty clear that it checks an array of allowed paths and then checks for host paths that are not in the list. There are other helper functions in the template.
Let’s look at another policy, Do not allow privileged containers in Kubernetes cluster. This one is pretty clear. It prevents you from creating a pod that has privileged: true in its securityContext. Suppose you have the following YAML:
If you try to apply the above YAML, the following error will be thrown:
Oops, privileged: true is not allowed (don’t look at the capabilities yet 😀)
As you can see, because we set the initiative to deny, the requests are denied in real-time by the Gatekeeper admission controller!
Let’s look at one more policy: Kubernetes cluster containers should only use allowed capabilities. With this policy, you can limit the Linux capabilities that can be added to your pod. An example of a capability is NET_BIND_SERVICE, which allows you to bind to a port below 1024, something a non-root user cannot do. By default, there is an array of allowedCapabilities which is empty. In addition, there is an array of requiredDropCapabilities which is empty as well. Note that this policy does not impact the default capabilities you pods will get. It does impact the additional ones you want to add. For example, if you use the securityContext below, you are adding additional capabilities NET_ADMIN and SYS_TIME:
By checking the contraint policy of the other templates, it will be quite straightforward to see what the policy checks for.
Note: when I export the policy initiative to GitHub (preview feature) I do see the default capabilities; see the snippet below (capabilities match the list that Gatekeeper reports above)
In most cases, you will want to enable Azure Policy for Kubernetes to control what workloads can do. We have only scratched the surface here. Next to the two initiatives, there are several other policies to control things such as GitOps configurations, the creation of external load balancers, require pod requests and limits and much much more!
In this post, I will provide some more information about the pipelines. Again, many thanks to this post on which the solution is based.
The YAML pipelines can be found in my go-template repository. The application is basically a starter template to create a Go web app or API with full configuration, zap logging, OpenAPI spec and more. The Azure DevOps pipelines are in the azdo folder.
The big picture
Yes, this is the big picture
The pipelines are designed to deploy to a qa environment and subsequently to production after an approval is given. The ci pipeline builds a container image and a Helm chart and stores both in Azure Container Registry (ACR). When that is finished, a pipeline artifact is stored that contains the image tag and chart version in a JSON file.
The cd pipeline triggers on the ci pipeline artifact and deploys to qa and production. It waits for approval before deployment to production. It uses environments to achieve that.
CI pipeline
In the “ci” pipeline, the following steps are taken:
Retrieve the git commit SHA with $(build.SourceVersion) and store it in a variable called imageTag. To version the images, we simply use git commit SHAs which is a valid approach. Imho you do not need to use semantic versioning tags with pipelines that deploy often.
Build the container image. Note that the Dockerfile is a two stage build and that go test is used in the first stage. Unit tests are not run outside the image building process but you could of course do that as well to fail faster in case there is an issue.
Scan the image for vulnerabilities with Snyk. This step is just for reference because Snyk will not find issues with the image as it is based on the scratch image.
Push the container image to Azure Container Registry (ACR). Pipeline variables $(registryLogin) and $(registryPassword) are used with docker login instead of the Azure DevOps task.
Run helm lint to check the chart in /charts/go-template
Run helm package to package the chart (this is not required before pushing the chart to ACR; it is just an example)
When the above steps have finished, we are ready to push the chart to ACR. It is important to realize that storing charts in OCI compliant registries is an experimental feature of Helm. You need to turn on these features with:
export HELM_EXPERIMENTAL_OCI=1
After turning on this support, we can login to ACR and push the chart. These are the steps:
Use helm registry login and use the same login and password as with docker login
Save the chart in the checked out sources (/charts/go-template) locally with helm chart save. This is similar to building and storing a container image locally as you also use the full name to the chart. For example: myacr.azurecr.io/helm/go-template:0.0.1. In our pipeline, the below command is used:
chartVersion=`helm chart save charts/go-template $(registryServerName)/helm/$(projectName) | grep version | awk -F ': ' '{print $2}'`
Above, we run the helm chart save command but we also want to retrieve the version of the chart. That version is inside /charts/go-template/Chart.yaml and is output as version. With grep and awk, we grab the version and store it in the chartVersion variable. This is a “shell variable”, not a pipeline variable.
With the chart saved locally, we can now push the chart to ACR with:
Do you have to do it this way? Of course not and there are many alternatives. For instance, because OCI support is experimental in helm and storing charts in ACR is in preview, you might want to install your chart directly from your source files. In that case, you can just build the container image and push it to ACR. The deployment pipeline can then checkout the sources and use /charts/go-template as the source for the helm install or helm upgrade command. The deployment pipeline could be triggered on the image push event.
Note that the pipeline uses templates for both the variables and the steps. The entire pipeline is the three files below:
azdo/ci.yaml
azdo/common/ci-vars.yaml
azdo/common/ci-steps.yaml
The ci-vars template defines and accepts a parameter called projectName which is go-template in my case. To call the template and set the parameter:
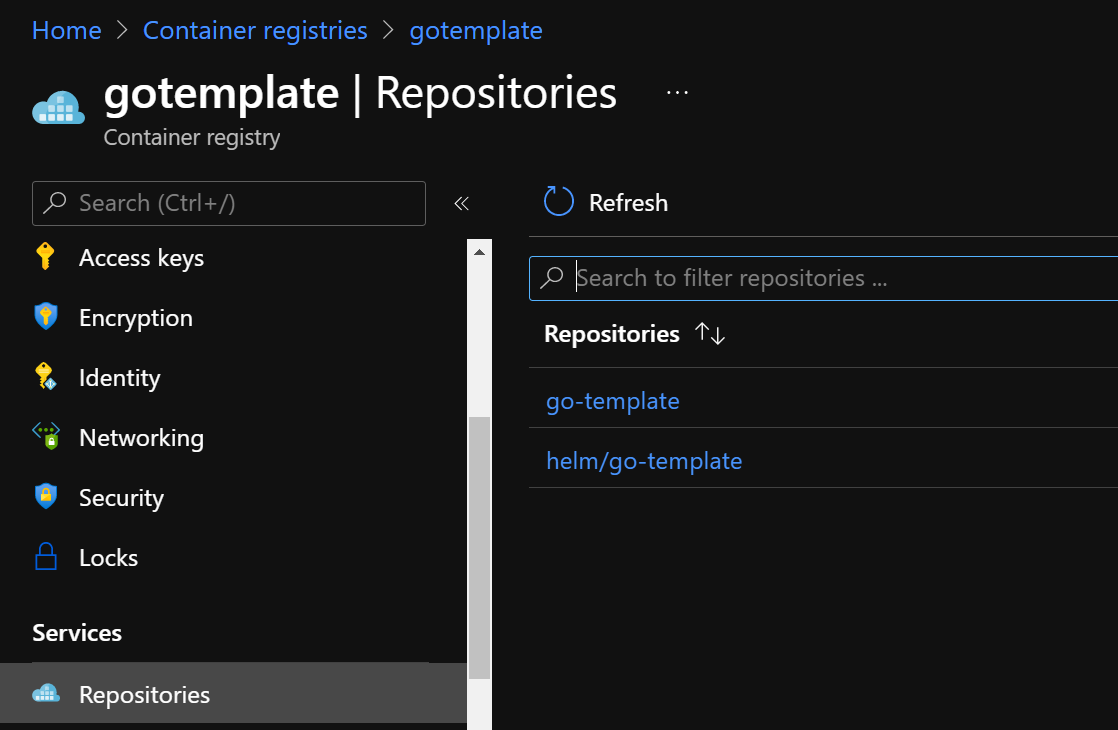
Now that we have both the chart and the container image in ACR, we can start our deployment. The screenshot below shows the repositories in ACR:
ACR repos for both the image and Helm chart
The deployment pipeline is defined in cd.yaml and uses cd-vars.yaml and cd-steps.yaml as templates. It pays off to use a template here because we execute the same steps in each environment.
The deployment pipeline triggers on the pipeline artifact from ci, by using resources as below:
resources:
  pipelines:
  - pipeline: ci
    source: ci
    trigger:
      enabled: true
      branches:
        include:
          - main
When the pipeline is triggered, the stages can be started, beginning with the qa stage:
This pipeline deploys both qa and production to the same cluster but uses different namespaces. The namespace is defined in the stage’s variables, next to a replicas variable. Note that we are using an environment here. We’ll come back to that.
The actual magic (well, sort of…) happens in cd-steps.yaml:
Do not checkout the source files; we do not need them
Install helm with the HelmInstaller task
Download the pipeline artifact
After the download of the pipeline artifact, there is one final bash script that logs on to Kubernetes and deploys the chart:
Use az login to login with Azure CLI. You can also use an AzureCLI task with a service connection to authenticate. I often just use bash but that is personal preference.
az login uses a service principal; the Id and secret of the service principal are in pipeline secrets
In my case, the service principal is member of a group that was used as an admin group for managed AAD integration with AKS; as such the account has full access to the AKS cluster; that also means I can obtain a kube config using –admin in az aks get-credentials without any issue
If you want to use a custom RBAC role for the service principal and an account that cannot use –admin, you will need to use kubelogin to obtain the AAD tokens to modify your kube config; see the comments in the bash script for more information
Phew, with the login out of the way, we can grab the Helm chart and install it:
Use export HELM_EXPERIMENTAL_OCI=1 to turn on the experimental support
Login to ACR with helm registry login
Grab the chart version and image version from the pipeline artifact:
Of course, to install the chart, we use helm upgrade but fall back to installation if this is the first time we run the command (–install). Note that we have to set some parameters at install time such as:
image.repository: in the values.yaml file, the image refers to ghcr.io; we need to change this to myacr.azurecr.io/go-template
image.tag: set this to the git commit SHA we grabbed from variables.json
replicaCount: set this to the stage variable replicas
namespace: set this to the stage variable k8sNamespace and use –create-namespace to create it if it does not exist; in many environments, this will not work as the namespaces are created by other teams with network policies, budgets, RBAC, etc…
Environments
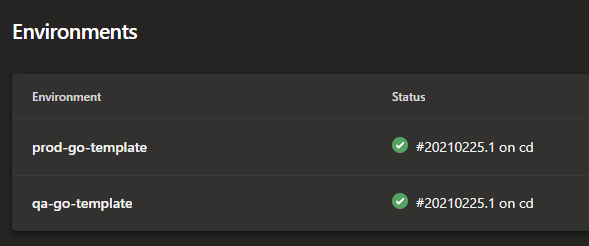
As discussed earlier, the stages use environments. This shows up in Azure DevOps as follows:
Environments in Azure DevOps
You can track the deployments per environment:
Deployments per environment
And of course, you can set approvals and checks on an environment:
Approvals and checks; above we only configured an approval check on production
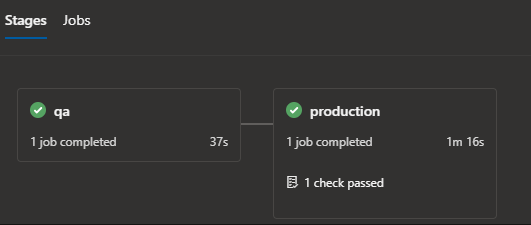
When you deploy, you will need to approve manually to deploy to production. You can do that from the screen that shows the stages of the pipeline run:
This now shows the check is passed; but this is the place where you can approve the stage
Note that you do not have to create environments before you use them in a pipeline. They will be dynamically created by the pipeline Usually though, they are created in advance with the appropriate settings such as approvals and checks.
You can also add resources to the environment such as your Kubernetes cluster. This gives you a view on Kubernetes, directly from Azure DevOps. However, if you deploy a private cluster, as many enterprises do, that will not work. Azure DevOps needs line of sight to the API server to show the resources properly.
Summary
What can I say? 😀 I hope that this post, the video and the sample project and pipelines can get you started with deployments to Kubernetes using Helm. If you have questions, feel free to drop them in the comments.
In the previous post, we looked at some of the GitHub Actions you can use with Microsoft Azure. One of those actions is the azure/k8s-deploy action which is currently at v1.4 (January 2021). To use that action, include the following snippet in your workflow:
The above snippet uses baked manifests from an earlier azure/k8s-bake action that uses kustomize as the render engine. This is optional and you can use individual manifests without kustomize. It also replaces the image it finds in the baked manifest with an image that includes a specific tag that is set as a variable at the top of the workflow. Multiple images can be replaced if necessary.
The azure/k8s-deploy action supports different styles of deployments, defined by the strategy action input:
none: if you do not specify a strategy, a standard Kubernetes rolling update is performed
canary: deploy a new version and direct a part of the traffic to the new version; you need to set a percentage action input to control the traffic split; in essence, a percentage of your users will use the new version
blue-green: deploy a new version next to the old version; after testing the new version, you can switch traffic to the new version
In this post, we will only look at the canary deployment. If you read the description above, it should be clear that we need a way to split the traffic. There are several ways to do this, via the traffic-split-method action input:
pod: the default value; by tweaking the amount of “old version” and “new version” pods, the standard load balancing of a Kubernetes service will approximate the percentage you set; pod uses standard Kubernetes features so no additional software is needed
smi: you will need to implement a service mesh that supports TrafficSplit; the traffic split is controlled at the request level by the service mesh and will be precise
Although pod traffic split is the easiest to use and does not require additional software, it is not very precise. In general, I recommend using TrafficSplit in combination with a service mesh like linkerd, which is very easy to implement. Other options are Open Service Mesh and of course, Istio.
With this out of the way, let’s see how we can implement it on a standard Azure Kubernetes Service (AKS) cluster.
Installing linkerd
Installing linkerd is easy. First install the cli on your system:
curl -sL https://run.linkerd.io/install | sh
Alternatively, use brew to install it:
brew install linkerd
Next, with kubectl configured to connect to your AKS cluster, run the following commands:
We will use three manifests, in combination with kustomize. You can find them on GitHub. In namespace.yaml, the linkerd.io/injectannotation ensures that the entire namespace is meshed. Every pod you create will get the linkerd sidecar injected, which is required for traffic splitting.
In the GitHub workflow, the manifests will be “baked” with kustomize. The result will be one manifest file:
The action above requires an id. We will use that id to refer to the resulting manifest later with:
${{ steps.bake.outputs.manifestsBundle }}
Important note: I had some trouble using the baked manifest and later switched to using the individual manifests; I also deployed namespace.yaml in one action and then deployed service.yaml and deployment.yaml is a separate action; to deploy multiple manifests, use the following syntax:
We got to start somewhere so we will deploy version 0.0.1 of the ghcr.io/gbaeke/go-template image. In the deployment workflow, we set the IMAGE_TAG variable to 0.0.1 and have the following action:
- uses: azure/k8s-deploy@v1.4
with:
namespace: go-template
manifests: ${{ steps.bake.outputs.manifestsBundle }}
# or use individual manifests in case of issues 🙂
images: |
ghcr.io/gbaeke/go-template:${{ env.IMAGE_TAG }}
strategy: canary
traffic-split-method: smi
action: deploy #deploy is the default; we will later use this to promote/reject
percentage: 20
baseline-and-canary-replicas: 2
Above, the action inputs set the canary strategy, using the smi method with 20% of traffic to the new version. The deploy action is used which results in “canary” pods of version 0.0.1. It’s not actually a canary because there is no stable deployment yet and all traffic goes to the “canary”.
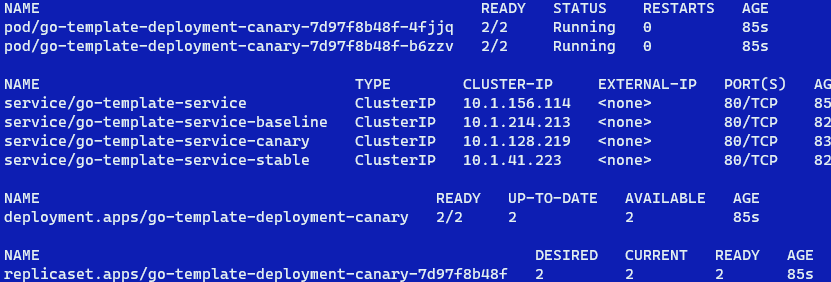
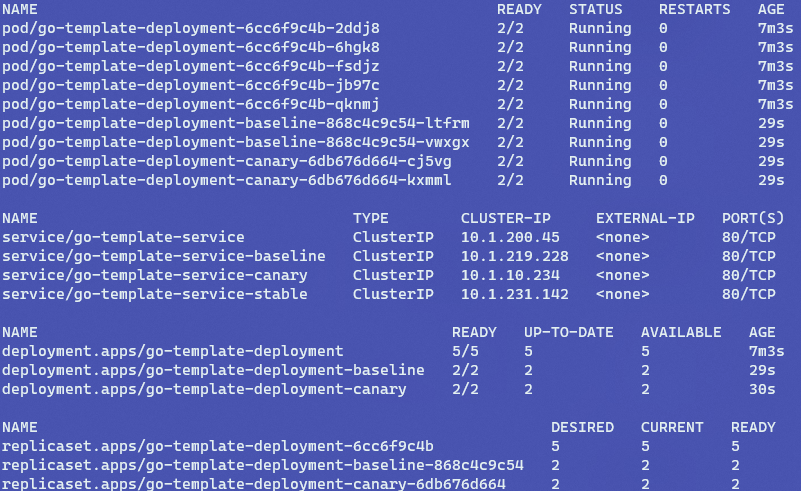
This is what gets deployed:
Initial, canary-only release
There only is a canary deployment with 2 canary pods in the deployment (we asked for 2 explicitly in the action). There are four services: the main go-template-service and then a service for baseline, canary and stable. Instead of deploy, you can use promote directly (action: promote) to deploy a stable version right away.
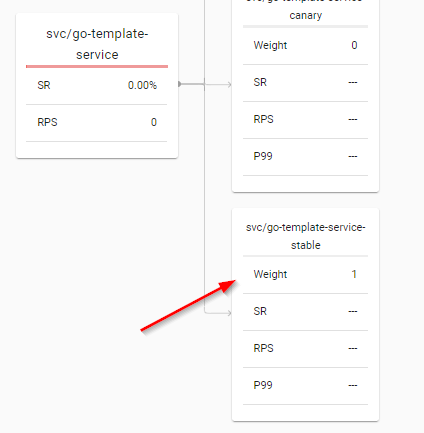
If we run linkerd dashboard we can check the namespace and the Traffic Split:
TrafficSplit in linkerd; all traffic to canary
Looked at in another way:
TrafficSplit
All traffic goes to the canary. In the Kubernetes TrafficSplit object, the weight is actually set to 1000m which is shown as 1 above.
Promotion
We can now modify the pipeline, change the action input action of azure/k8s-deploy to promote and trigger the workflow to run. This is what the action should look like:
- uses: azure/k8s-deploy@v1.4
  with:
    namespace: go-template
    manifests: ${{ steps.bake.outputs.manifestsBundle }}
    images: |
      ghcr.io/gbaeke/go-template:${{ env.IMAGE_TAG }}
strategy: canary
traffic-split-method: smi
action: promote #deploy is the default; we will later use this to promote/reject
percentage: 20
baseline-and-canary-replicas: 2
This is the result of the promotion:
After promotion
As expected, we now have 5 pods of the 0.0.1 deployment. This is the stable deployment. The canary pods have been removed. We get five pods because that is the number of replicas in deployment.yaml. The baseline-and-canary-replicas action input is not relevant now as there are no canary and baseline deployments.
The TrafficSplit now directs 100% of traffic to the stable service:
All traffic to “promoted” stable service
Deploying v0.0.2 with 20% split
Now we can deploy a new version of our app, version 0.0.2. The action is the same as the initial deploy but IMAGE_TAG is set to 0.0.2:
- uses: azure/k8s-deploy@v1.4
  with:
    namespace: go-template
    manifests: ${{ steps.bake.outputs.manifestsBundle }}
    images: |
      ghcr.io/gbaeke/go-template:${{ env.IMAGE_TAG }}
    strategy: canary
    traffic-split-method: smi
    action: deploy #deploy is the default; we will later use this to promote/reject
    percentage: 20
    baseline-and-canary-replicas: 2
Running this action results in:
Canary deployment of 0.0.2
The stable version still has 5 pods but canary and baseline pods have been added. More info about baseline below.
TrafficSplit is now:
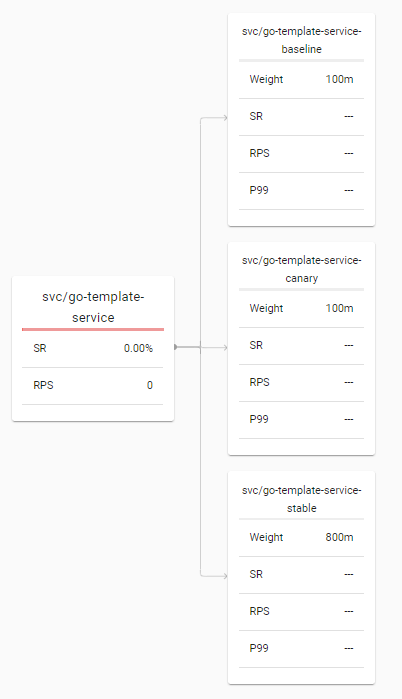
TrafficSplit: 80% to stable and 20% to baseline & canary
Note that the baseline pods uses the same version as the stable pods (here 0.0.1). The baseline should be used to compare metrics with the canary version. You should not compare the canary to stable because factors such as caching might influence the comparison. This also means that, instead of 20%, only 10% of traffic goes to the new version.
Wait… I have to change the pipeline to promote/reject?
Above, we manually changed the pipeline and ran it manually from VS Code or the GitHub website. This is possible with triggers such as repository_dispatch and workflow_dispatch. There are (or should be) some ways to automate this better:
GitHub environments: with Azure DevOps, it is possible to run jobs based on environments and the approve/reject status; I am still trying to figure out if this is possible with GitHub Actions but it does not look like it (yet); if you know, drop it in the comments; I will update this post if there is a good solution
workflow_dispatch inputs: if you do want to run the workflow manually, you can use workflow_dispatch inputs to approve/reject or do nothing
Should you use this?
While I think the GitHub Action works well, I am not in favor of driving all this from GitHub, Azure DevOps and similar solutions. There’s just not enough control imho.
Solutions such as flagger or Argo Rollouts are progressive delivery operators that run inside the Kubernetes cluster. They provide more operational control, are fully automated and can be integrated with Prometheus and/or service mesh metrics. For an example, check out one of my videos. When you need canary and/or blue-green releases and you are looking to integrate the progression of your release based on metrics, surely check them out. They also work well for manual promotion via a CLI or UI if you do not need metrics-based promotion.
Conclusion
In this post we looked at the “mechanics” of canary deployments with GitHub Actions. An end-to-end solution, fully automated and based on metrics, in a more complex production application is quite challenging. If your particular application can use simpler deployment methods such as standard Kubernetes deployments or even blue-green, then use those!
In this post, we will take a look at doing the above with GitHub Actions. Along the way, we will look at a VS Code extension for GitHub Actions, manually triggering a workflow from VS Code and GitHub and manifest deployment to AKS.
Let’s dive is, shall we?
Getting ready
What do you need to follow along:
Some experience with Azure and AKS
A GitHub account: workflows, ARM templates and YAML used in this post are in my azure-deploy repo
Although you can deploy Azure Kubernetes Service (AKS) in many ways (manual, CLI, ARM, Terraform, …), we will use ARM and the azure/arm-deploy@v1 action in a workflow we can trigger manually. The workflow (without the Flux bootstrap section) is shown below:
To create this workflow, add a .yml file (e.g. deploy.yml) to the .github/workflows folder of the repository. You can add this directly from the GitHub website or use VS Code to create the file and push it to GitHub.
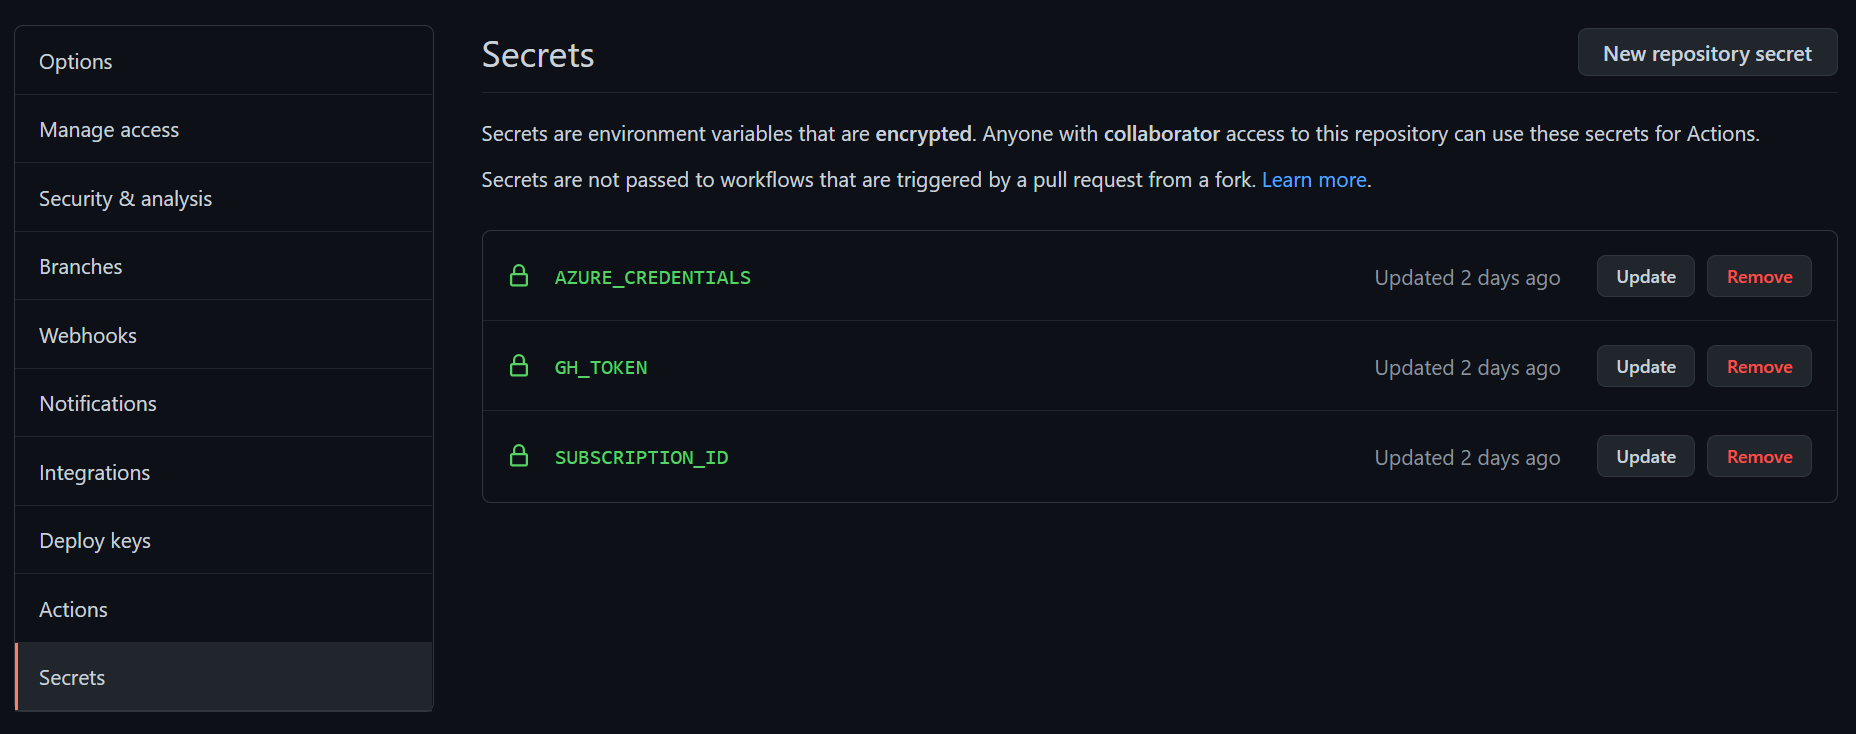
The above workflow uses several of the Azure GitHub Actions, starting with the login. The azure/login@v1 action requires a GitHub secret that I called AZURE_CREDENTIALS. You can set secrets in your repository settings. If you use an organization, you can make it an organization secret.
GitHub Repository Secrets
If you have the GitHub Actions VS Code extension, you can also set them from there:
Setting and reading the secrets from VS Code
If you use the gh command line, you can use the command below from the local repository folder:
gh secret set SECRETNAME --body SECRETVALUE
The VS Code integration and the gh command line make it easy to work with secrets from your local system rather than having to go to the GitHub website.
The secret should contain the full JSON response of the following Azure CLI command:
az ad sp create-for-rbac --name "sp-name" --sdk-auth --role ROLE \
     --scopes /subscriptions/SUBID
The above command creates a service principal and gives it a role at the subscription level. That role could be contributor, reader, or other roles. In this case, contributor will do the trick. Of course, you can decide to limit the scope to a lower level such as a resource group.
After a successful login, we can use an ARM template to deploy AKS with the azure/arm-deploy@v1 action:
The action’s parameters are self-explanatory. For an example of an ARM template and parameters to deploy AKS, check out this example. I put my template in the aks folder of the GitHub repository. Of course, you can deploy anything you want with this action. AKS is merely an example.
When the cluster is deployed, we can download a specific version of kubectl to the GitHub runner that executes the workflow. For instance:
Note that the Ubuntu GitHub runner (we use ubuntu-latest here) already contains kubectl version 1.19 at the time of writing. The azure/setup-kubectl@v1 is useful if you want to use a specific version. In this specific case, the azure/setup-kubectl@v1 action is not really required.
Now we can obtain credentials to our AKS cluster with the azure/aks-set-context@v1 task. We can use the same credentials secret, in combination with the cluster name and resource group set as a workflow environment variable:
In this case, the AKS API server has a public endpoint. When you use a private endpoint, run the GitHub workflow on a self-hosted runner with network access to the private API server.
Bootstrapping with Flux v2
To bootstrap the cluster with tools like nginx and cert-manager, Flux v2 is used. The commands used in the original Azure DevOps pipeline can be reused:
For an explanation of these commands, check this post.
Running the workflow manually
As noted earlier, we want to be able to run the workflow from the GitHub Actions extension in VS Code and the GitHub website instead of pushes or pull requests. The following triggers make this happen:
on:
  repository_dispatch:
    types: [deploy]
  workflow_dispatch:
The VS Code extension requires the repository_dispatch trigger. Because I am using multiple workflows in the same repo with this trigger, I use a unique event type per workflow. In this case, the type is deploy. To run the workflow, just right click on the workflow in VS Code:
Running the workflow from VS Code
You will be asked for the event to trigger and then the event type:
Selecting the deploy event type
The workflow will now be run. Progress can be tracked from VS Code:
Tracking workflow runs
Update Jan 7th 2021: after writing this post, the GitHub Action extension was updated to also support workflow_dispatch which means you can use workflow_dispatch to trigger the workflow from both VS Code and the GitHub website ⬇⬇⬇
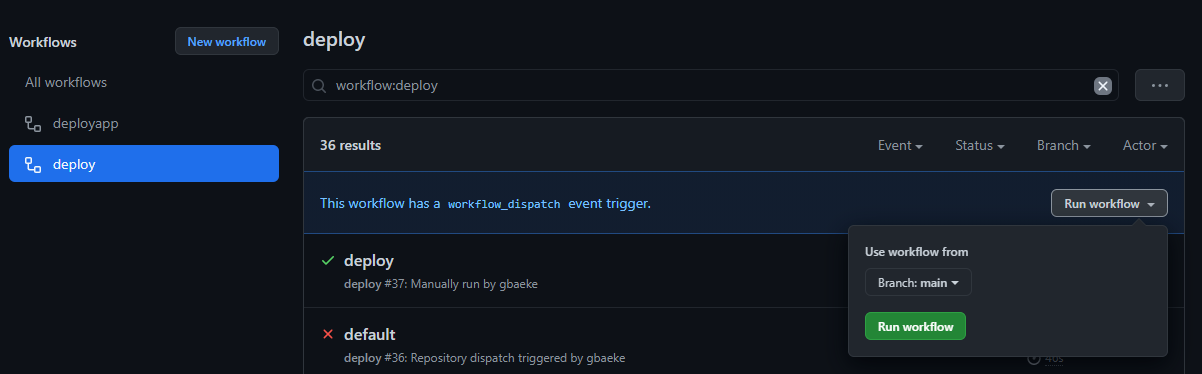
To run the workflow from the GitHub website, workflow_dispatch is used. On GitHub, you can then run the workflow from the web UI:
Running the workflow from GitHub
Note that you can specify input parameters to workflow_dispatch. See this doc for more info.
Deploying manifests
As shown above, deploying AKS from a GitHub workflow is rather straightforward. The creation of the ARM template takes more effort. Deploying a workload from manifests is easy to do as well. In the repo, I created a second workflow called app.yml with the following content:
azure/k8s-bake@v1: create one manifest file using kustomize; note that the action uses kubectl kustomize instead of the standalone kustomize executable; the action should refer to a folder that contains a kustomization.yaml file; see this link for an example
azure/k8s-deploy@v1: deploy the baked manifest (which is an output from the task with id=bake) to the go-template namespace on the cluster; replace the image to deploy with the image specified in the images list (the tag can be controlled with the workflow environment variable IMAGE_TAG)
Note that the azure/k8s-deploy@v1 task supports canary and blue/green deployments using several techniques for traffic splitting (Kubernetes, Ingress, SMI). In this case, a regular Kubernetes deployment is used, equivalent to kubectl apply -f templatefile.yaml.
Conclusion
I only touched upon a few of the Azure GitHub Actions such as azure/login@v1 and azure/k8s-deploy@v1. There are many more actions available that allow you to deploy to Azure Container Instances, Azure Web App and more. We have also looked at running the workflows from VS Code and the GitHub website, which is easy to do with the repository_dispatch and workflow_dispatch triggers.