A few days ago, I had to map the domain inity.io to a Netlify domain. If you have only worked with DNS once in your life, you probably know about these two types of records:
CNAME: a CNAME record maps a name to another name; I can, for instance, create a CNAME record that maps http://www.inity.io to somedomain.netlify.com
With that knowledge in your bag, it would seem that a CNAME record is the way to map inity.io to somedomain.netlify.com. Sadly, that is not the case because CNAMEs cannot coexist with other records for the domain. In the case of the root or apex domain, there are existing records for the root domain such as the NS records.
If your DNS provider supports ALIAS records, you are in luck. From a high level, an ALIAS record works like a CNAME record although there are several lower level differences we won’t all go into.
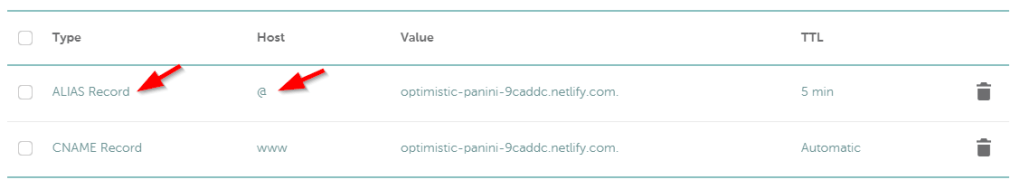
Since I use namecheap.com and they support ALIAS records, it was easy to map inity.io to somedomain.netlify.com:
Namecheap ALIAS record
The ALIAS record only supports a 1 or 5 minute TTL. The host is @ which represents the root domain. Notice I also redirect http://www.inity.io to the Netlify domain with a regular CNAME.
What does dig say?
Let’s look at what dig returns for both the ALIAS and CNAME record. Here’s the dig output for ALIAS (with some lines removed):
λ geba:~  dig inity.io


;; ANSWER SECTION:
inity.io.               300     IN      A       167.99.129.42
The authoritative server does all the work here and returns the IP address directly to you. That does not happen for the CNAME:
λ geba:~  dig www.inity.io

;; ANSWER SECTION:
www.inity.io.           1799    IN      CNAME   optimistic-panini-9caddc.netlify.com.
optimistic-panini-9caddc.netlify.com. 20 IN A   167.99.129.42
Some more work needs to be done here since you get back the CNAME record which then needs to be resolved to the IP address.
What about Azure and Front Door?
If you work with Front Door and want to map the root or apex domain to a Front Door frontend such as my.azurefd.net, the same issue arises. The Microsoft docs contain a good article explaining the concepts: https://docs.microsoft.com/en-us/azure/frontdoor/front-door-how-to-onboard-apex-domain. From that document, you will learn that Azure DNS also supports “aliases” with an easy dropdown list to select your Front Door frontend host. If you want to use SSL for the frontend host, you will need to bring your own certificate because automatic certificates are not supported with APEX domains.
Note that you do not have to use Azure DNS. An ALIAS record at NameCheap or other providers would work equally well. CloudFlare also supports APEX domains via CNAME Flattening. Just don’t use GoDaddy. 😲
This post is a companion to the following GitHub repository: https://github.com/gbaeke/aks-traefik-azure-deploy. The repository contains ARM templates to deploy an AD integrated Kubernetes cluster and an IP address plus a Helm chart to deploy Traefik. Traefik is configured to use the deployed IP address. In addition to those files, the repository also contains the YAML pipeline, ready to be imported in Azure DevOps.
Let’s take a look at the different building blocks!
AKS ARM Template
The aks folder contains the template and a parameters file. You will need to modify the parameters file because it requires settings to integrate the AKS cluster with Azure AD. You will need to specify:
clientAppID: the ID of the client app registration
serverAppID: the ID of the server app registration
tenantID: the ID of your AD tenant
Also specify clientId, which is the ID of the service principal for your cluster. Both the serverAppID and the clientID require a password. The passwords have been set via a pipeline secret variable.
The template configures a fairly standard AKS cluster that uses Azure networking (versus kubenet). It also configures Log Analytics for the cluster (container insights).
Deploying the template from the YAML file is done with the task below. You will need to replace YOUR SUBSCRIPTION with an authorized service connection:
The task uses several variables like $(aksTestRG) etc… If you check azure-pipelines.yaml, you will notice that most are configured at the top of the file in the variables section:
The two secrets are the secret 🔐 vaiables. Naturally, they are configured in the Azure DevOps UI. Note that there are other means to store and obtain secrets, such as Key Vault. In Azure DevOps, the secret variables can be found here:
Azure DevOps secret variables
IP Address Template
The ip folder contains the ARM template to deploy the IP address. We need to deploy the IP address resource to the resource group that holds the AKS agents. With the names we have chosen, that name is MC_rg-clu-test_clu-test_westeurope. It is possible to specify a custom name for the resource group.
Because we want to obtain the IP address after deployment, the ARM template contains an output:
The output ipaddress is of type string. Via the reference template function we can extract the IP address.
The ARM template is deployed like the AKS template but we need to capture the ARM outputs. The last line of the AzureResourceGroupDeployment@2 that deploys the IP address contains:
deploymentOutputs: 'armoutputs'
Now we need to extract the IP address and set it as a variable in the pipeline. One way of doing this is via a bash script:
You can set a variable in Azure DevOps with echo##vso[task.setvariable variable=variable_name;]value. In our case, the “value” should be the raw string of the IP address output. The $(armoutputs) variable contains the output of the IP address ARM template as follows:
To extract IP ADDRESS, we pipe the output of “echo $(armoutputs)” to js .ipaddress.value -r which extracts the IP ADDRESS from the JSON. The -r parameter removes double quotes from the IP ADDRESS to give us the raw string. For more info about jq, check https://stedolan.github.io/jq/ .
We now have the IP address in the test-ip variable, to be used in other tasks via $(test-ip).
Taking care of the prerequisites
In a later phase, we install Traefik via Helm. So we need kubectl and helm on the build agent. In addition, we need to install tiller on the cluster. Because the cluster is RBAC-enabled, we need a cluster account and a role binding as well. The following tasks take care of all that:
Note that we use the AzureCLI built-in task to easily obtain the cluster credentials for kubectl on the build agent. We use the –admin flag to gain full access. Note that this downloads sensitive information to the build agent temporarily.
The last task just runs a shell script to configure the service account and role binding and install tiller. Check the repository to see the contents of this simple script. Note that this is the quick and easy way to install tiller, not the most secure way! 🙇♂️
Install Traefik and use the IP address
The repository contains the downloaded chart (helm fetch stable/traefik –untar). The values.yaml file was modified to set the ingressClass to traefik-ext. We could have used the chart from the Helm repository but I prefer having the chart in source control. Here’s the pipeline task:
kubectl is configured to use the cluster so connectionType can be set to ‘None’. We simply specify the IP address we created earlier by setting loadBalancerIP to $(test-ip) with the overrides for values.yaml. This sets the loadBalancerIP setting in Traefik’s service definition (in the templates folder). Service.yaml in the templates folder contains the following section:
 spec:
  type: {{ .Values.serviceType }}
  {{- if .Values.loadBalancerIP }}
  loadBalancerIP: {{ .Values.loadBalancerIP }}
  {{- end }}
Conclusion
Deploying AKS together with one or more public IP addresses is a common scenario. Hopefully, this post together with the GitHub repo gave you some ideas about automating these deployments with Azure DevOps. All you need to do is create a pipeline from the repo. Azure DevOps will read the azure-pipelines.yml file automatically.
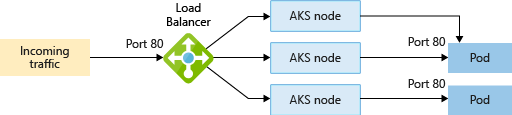
For a customer that is developing a microservices application, the proposed architecture contains two Kubernetes ingresses:
internal ingress: exposed via an Azure internal load balancer, deployed in a separate subnet in the customer’s VNET; no need for SSL
external ingress: exposed via an external load balancer; SSL via Let’s Encrypt
The internal ingress exposes API endpoints via Azure API Management and its ability to connect to internal subnets. The external ingress exposes web applications via Azure Front Door.
The Ingress Controller of choice is Traefik. We use the Helm chart to deploy Traefik in the cluster. The example below uses Azure Kubernetes Service so I will refer to Azure objects such as VNETs, subnets, etc… Let’s get started!
Internal Ingress
In values.yaml, use ingressClass to set a custom class. For example:
 kubernetes:
  ingressClass: traefik-int
When you do not set this value, the default ingressClass is traefik. When you define the ingress object, you refer to this class in your manifest via the annotation below:
When we deploy the internal ingress, we need to tell Traefik to create an internal load balancer. Optionally, you can specify a subnet to deploy to. You can add these options under the service section in values.yaml:
The above setting makes sure that the annotations are set on the service that the Helm chart creates to expose Traefik to the “outside” world. The settings are not Traefik specific.
Above, we want Kubernetes to deploy the Azure internal load balancer to a subnet called traefik. That subnet needs to exist in the VNET that contains the Kubernetes subnet. Make sure that the AKS service principal has the necessary access rights to deploy the load balancer in the subnet. If it takes a long time to deploy the load balancer, use kubectl get events in the namespace where you deploy Traefik (typically kube-system).
If you want to provide an static IP address to the internal load balancer, you can do so via the loadBalancerIp setting near the top of values.yaml. You can use any free address in the subnet where you deploy the load balancer.
loadBalancerIP: 172.20.3.10
All done! You can now deploy the internal ingress with:
Note that we install the Helm chart from our local file system and that we are in the folder that contains the chart and values.yaml. Hence the dot (.) in the command.
TIP: if you want to use a private DNS zone to resolve the internal services, see the private DNS section in Azure API Management and Azure Kubernetes Service. Private DNS zones are still in preview.
External ingress
The external ingress is simple now. Just set the ingressClass to traefik-ext (or leave it at the default of traefik although that’s not very clear) and remove the other settings. If you want a static public IP address, you can create such an address first and specify it in values.yaml. In an Azure context, you would create a public IP object in the resource group that contains your Kubernetes nodes.
Conclusion
If you need multiple ingresses of the same type or brand, use distinct values for ingressClass and reference the class in your ingress manifest file. Naturally, when you use two different solutions, say Kong for APIs and Traefik for web sites, you do not need to do that since they use different ingressClass values by default (kong and traefik). Hope this quick tip was useful!
In the post, Securing your API with Kong and CloudFlare, I exposed a dummy API on Kubernetes with Kong and published it securely with CloudFlare. The breadth of features and its ease of use made CloudFlare a joy to work with. It didn’t take long before I got the question: “can’t you do that with Azure only?”. The answer is obvious: “Of course you can!”
In this post, the traffic flow is as follows:
Consumer -- HTTPS --> Azure Front Door with WAF policy -- HTTPS --> Kong (exposed with Azure Load Balancer) -- HTTP --> API Kubernetes service --> API pods
Similarly to CloudFlare, Azure Front Door provides a fully trusted certificate for consumers of the API. In contrast to CloudFlare, Azure Front Door does not provide origin certificates which are trusted by Front Door. That’s easy to solve though by using a fully trusted Let’s Encrypt certificate which is stored as a Kubernetes secret and used in the Kubernetes Ingress definition. For this post, I requested a wildcard certificate for *.baeke.info via https://www.sslforfree.com/
Let’s take it step-by-step, starting at the API and Kong level.
APIs and Kong
Just like in the previous posts, we have a Kubernetes service called func and back-end pods that host the API implemented via Azure Functions in a container. Below you see the API pods in the default namespace. For convenience, Kong is also deployed in that namespace (not recommended in production):
Kong will pick up the above definition and configure itself accordingly.
The API is exposed publicly via https://api-o.baeke.info where the o stands for origin. The secret wildcard-baeke.info.tls refers to a secret which contains the wildcard certificate for *.baeke.info:
Naturally, certificate and key should be replaced with the base64-encoded strings of the certificate and key you have obtained (in this case from https://www.sslforfree.com).
At the DNS level, api-o.baeke.info should refer to the external IP address of the exposed Kong Ingress Controller (proxy):
The service kong-kong-proxy is exposed via a public IP address (service of type LoadBalancer)
For the rest, the Kong configuration is not very different from the configuration in Securing your API with Kong and CloudFlare. I did remove the whitelisting configuration, which needs to be updated for Azure Front Door.
Great, we now have our API listening on https://api-o.baeke.info but it is not exposed via Azure Front Door and it does not have a WAF policy. Let’s change that.
Web Application Firewall (WAF) Policy
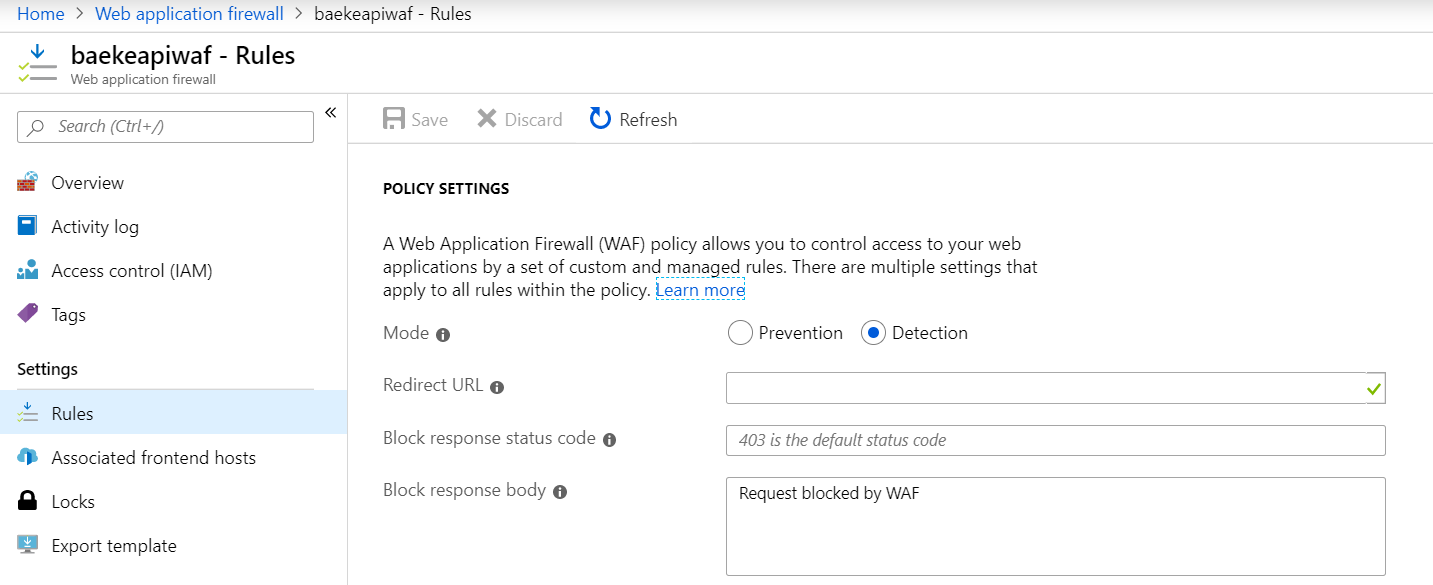
You can create a WAF policy from the portal:
WAF Policy
The above policy is set to detection only. No custom rules have been defined, but a managed rule set is activated:
Managed rule set for OWASP
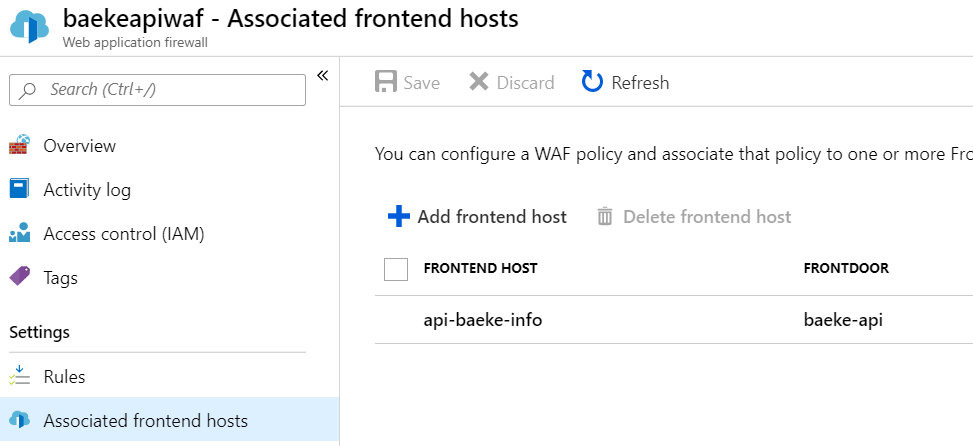
The WAF policy was saved as baekeapiwaf. It will be attached to an Azure Front Door frontend. When a policy is attached to a frontend, it will be shown in the policy:
Associated frontends (Front Door front-ends)
Azure Front Door
We will now add Azure Front Door to obtain the following flow:
Consumer ---> https://api.baeke.info (Front Door + WAF) --> https://api-o.baeke.info
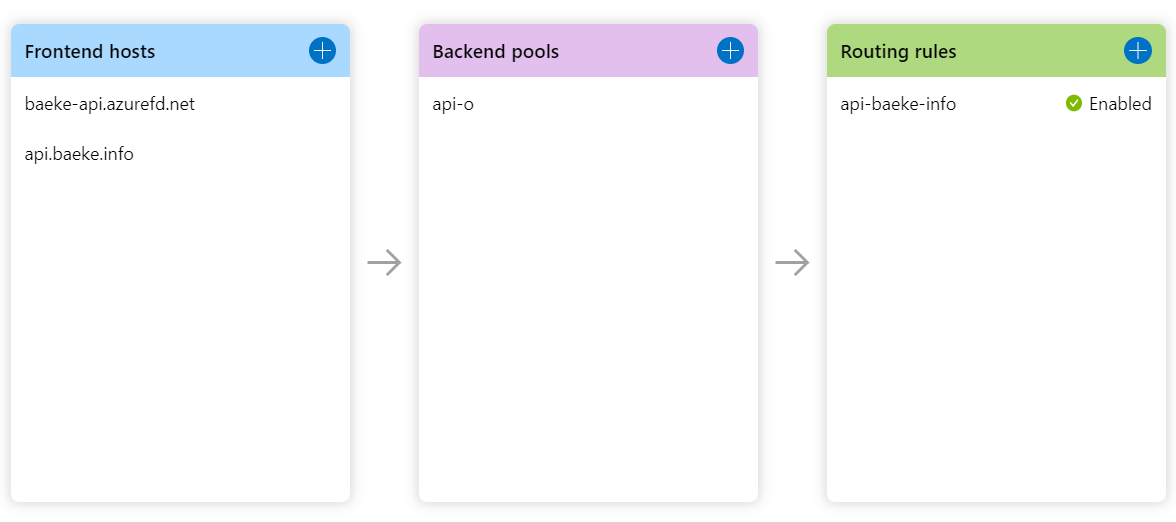
The final configuration in Front Door Designer looks like this:
Front Door Designer
When a request comes in for api.baeke.info, the response from api-o.baeke.info is served. Caching was not enabled. The frontend and backend are tied together via the routing rule.
The first thing you need to do is to add the azurefd.net frontend which is baeke-api.azurefd.net in the above config. There’s not much to say about that. Just click the blue plus next to Frontend hosts and follow the prompts. I did not attach a WAF policy to that frontend because it will not forward requests to the backend. We will use a custom domain for that.
Next, click the blue plus again to add the custom domain (here api.baeke.info). In your DNS zone, create a CNAME record that maps api.yourdomain.com to the azurefd.net name:
Mapping of custom domain to azurefd.net domain in CloudFlare DNS
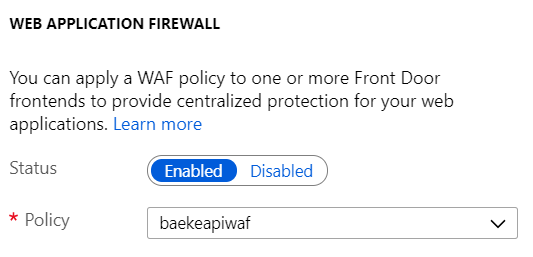
I attached the WAF policy baekeapiwaf to the front-end domain:
WAF policy with OWASP rules to protect the API
Next, I added a certificate. When you select Front Door managed, you will get a Digicert managed image. If the CNAME mapping is not complete, you will get an e-mail from Digicert to approve certificate issuance. Make sure you check your e-mails if it takes long to issue the certificate. It will take a long time either way so be patient! 💤💤💤
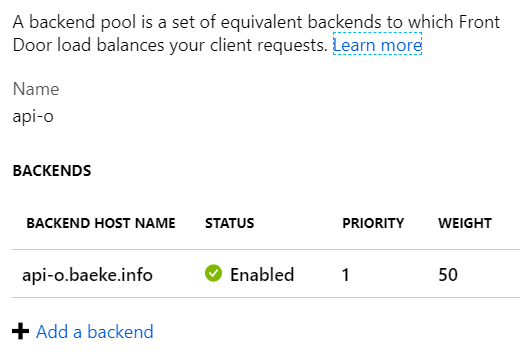
Now that we have the frontend, specify the backend that Front Door needs to connect to:
Backend pool
The backend pool uses the API exposed at api-o.baeke.info as defined earlier. With only one backend, priority and weight are of no importance. It should be clear that you can add multiple backends, potentially in different regions, and load balance between them.
You will also need a health probe to check for healthy and unhealthy backends:
Health probes of the backend
Note that the above health check does NOT return a 200 OK status code. That is the only status code that would result in a healthy endpoint. With the above config, Kong will respond with a “no Route matched” 404 Not Found error instead. That does not mean that Front Door will not route to this endpoint though! When all endpoints are in a failed state, Front Door considers them healthy anyway 😲😲😲 and routes traffic using round-robin. See the documentation for more info.
Now that we have the frontend and the backend, let’s tie the two together with a rule:
First part of routing rule
In the first part of the rule, we specify that we listen for requests to api.baeke.info (and not the azurefd.net domain) and that we only accept https. The pattern /* basically forwards everything to the backend.
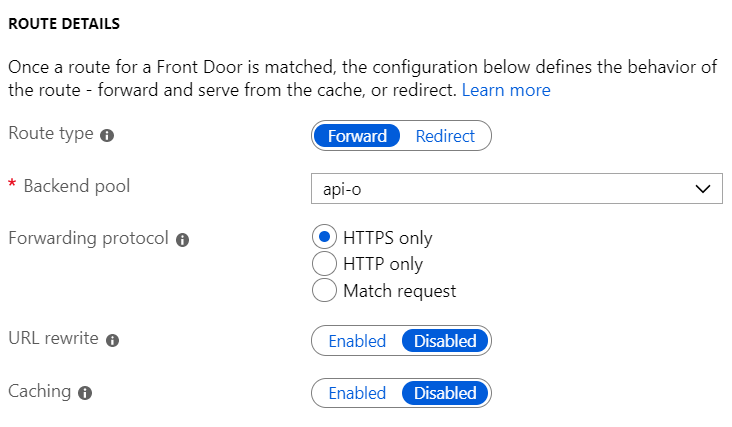
In the route details, we specify the backend to route to:
Backend to route to
Clearly, we want to route to the api-o backend we defined earlier. We only connect to the backend via HTTPS. It only accepts HTTPS anyway, as defined at the Kong level via a KongIngress resource.
Note that it is possible to create a HTTP to HTTPS redirect rule. See the post Azure Front Door Revisited for more information. Without the rule, you will get the following warning:
Please disregard this warning 😎
Test, test, test
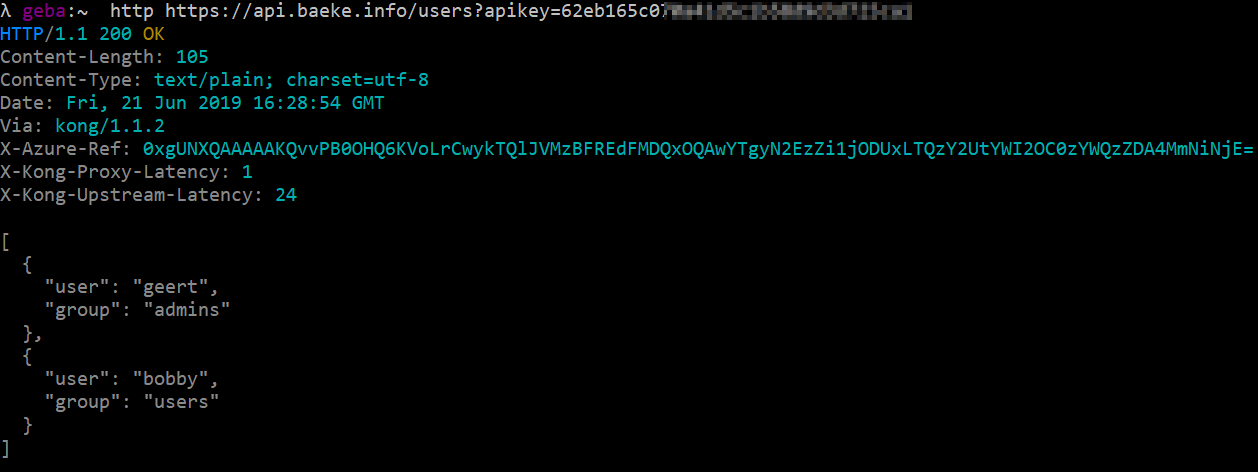
Let’s call the API via the http tool:
Clearly, Azure Front Door has served this request as indicated by the X-Azure-Ref header. Let’s try http:
Azure Front Door throws the above error because the routing rule only accepts https on api.baeke.info!
White listing Azure Front Door
To restrict calls to the backend to Azure Front Door, I used the following KongPlugin definition:
The IP range is documented here. Note that the IP range can and probably will change in the future.
In the ingress definition, I added the plugin via the annotations:
annotations:
  kubernetes.io/ingress.class: kong
  plugins.konghq.com: http-auth, whitelist-fd
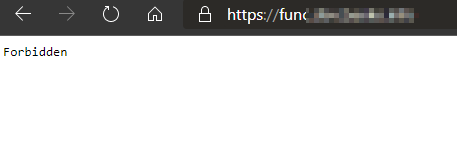
Calling the backend API directly will now fail:
That’s a no no! Please use the Front Door!
Conclusion
Publishing APIs (or any web app), whether they are running on Kubernetes or other systems, is easy to do with the combination of Azure Front Door and Web Application Firewall policies. Do take pricing into account though. It’s a mixture of relatively low fixed prices with variable pricing per GB and requests processed. In general, CloudFlare has the upper hand here, from both a pricing and features perspective. On the other hand, Front Door has advantages when it comes to automating its deployment together with other Azure resources. As always: plan, plan, plan and choose wisely! 🦉
In my previous blog post, I looked at Azure API Management in combination with private APIs hosted on Kubernetes. The APIs were exposed via Traefik and an internal load balancer. To make that scenario work, the Azure API Management premium SKU is required, which is quite costly.
This post describes another approach where the APIs are exposed on the public Internet via an Ingress Controller that requires HTTPS in addition to restricting the API caller to the IP address of the Azure API Management instance. Something like this:
Internet client -> Azure API Management --> Ingress Controller (with IP whitelisting per ingress) --> API service (Kubernetes) --> API pods (Kubernetes, part of a Deployment)
Let’s see how this works, shall we?
API Management
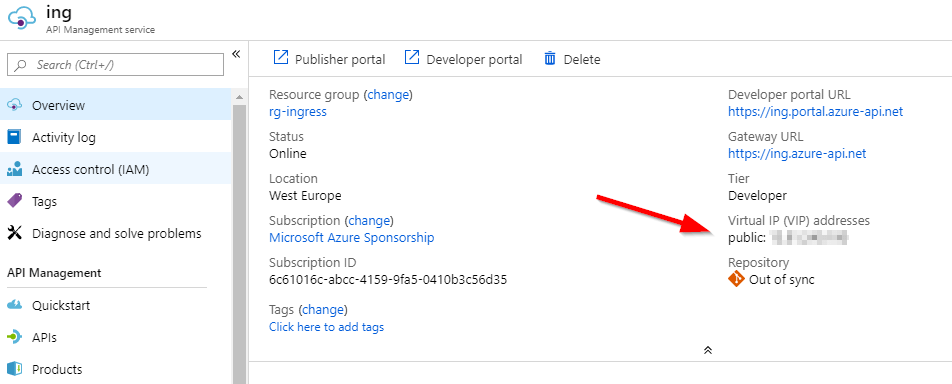
Deploy Azure API management from the portal. In this case, you can use the other SKUs such as Basic and Standard. Note the IP address of the Azure API Management instance on the Overview page:
IP address of API Management
Ingress Controller
As usual, let’s use Traefik. When you have Helm installed, use the following command:
Note the use of externalTrafficPolicy=Local. This lets Traefik know the IP address of the actual caller, which is required because we want to restrict access to the IP address of API Management.
Ingress object
When your API is deployed via a deployment and a service of type ClusterIP, use the following ingress definition:
The above ingress object, exposes the internal service func via Traefik. The whitelist-source-range annotation is used to limit access to this resource to the IP address of Azure API Management. Replace YOURIP with that IP address. Obviously, replace the host api.domain.com with a host that resolves to the external IP of the load balancer that provides access to Traefik. The Let’s Encrypt configuration automatically provisions a valid certificate to the service.
When I navigate to the API on my local computer, the following happens:
No access to the API if the request does not come from API management
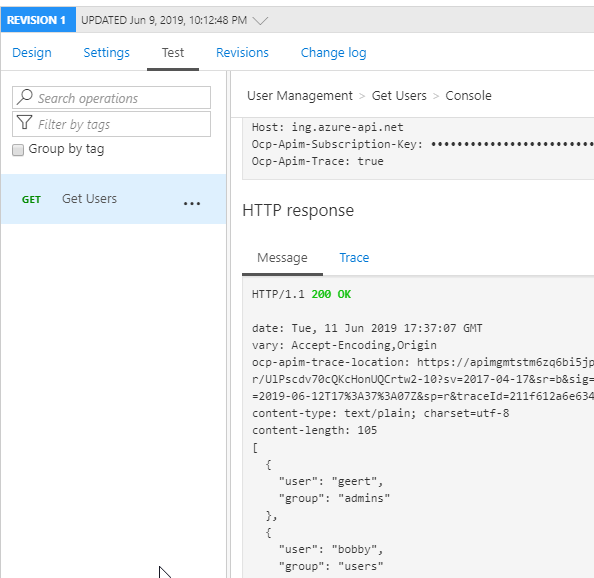
When I test the API from API Management (after setting the back-end correctly):
API management can call the back-end API
Conclusion
What do you do when you do not want to spend money on the premium SKU? The answer is clear: use the lower SKUs if possible and restrict access to the back-end APIs with other means such as IP whitelisting. Other possibilities include using some form of authentication such as basic authentication etc…
A while ago, the Azure DevOps blog posted an update about multi-stage YAML pipelines. The concept is straightforward: define both your build (CI) and release (CD) pipelines in a YAML file and stick that file in your source code repository.
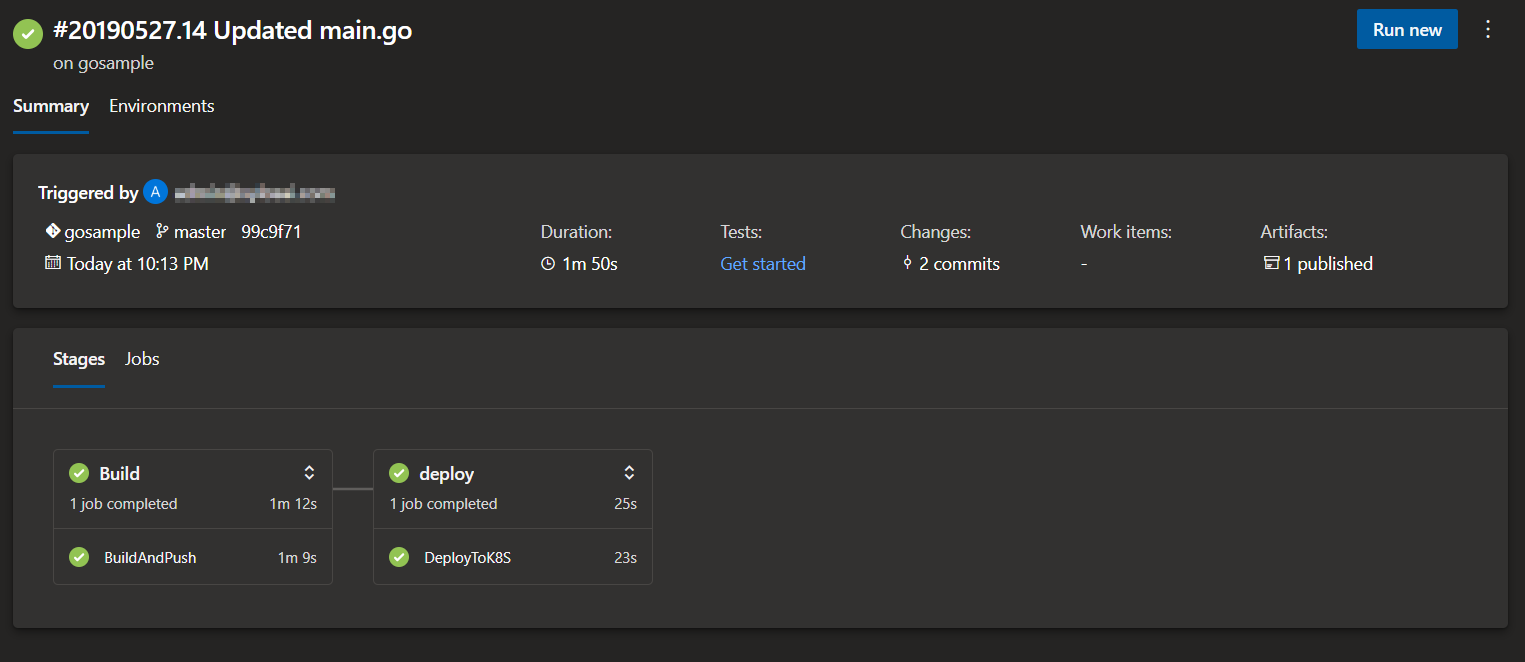
In this post, we will look at a simple build and release pipeline that builds a container, pushes it to ACR, deploys it to Kubernetes linked to an environment. Something like this:
Two stages in the pipeline – build and deploy (as simple as it can get, almost)
Note: I used a simple go app, a Dockerfile and a Kubernetes manifest as source files, check them out here.
Note: there is also a video version 😉
Note: if you start from a repository without manifests and azure-pipelines.yaml, the pipeline build wizard will propose Deploy to Azure Kubernetes Service. The wizard that follows will ask you some questions but in the end you will end up with a configured environment, the necessary service connections to AKS and ACR and even a service.yaml and deployment.yaml with the bare minimum to deploy your container!
“Show me the YAML!!!”
The file, azure-pipelines.yaml contains the two stages. Check out the first stage (plus trigger and variables) below:
The pipeline runs on a commit to the master branch. The variables imageName and registry are referenced later using $(imageName) and $(registry). Replace REGNAME with the name of your Azure Container Registry.
It’s a multi-stage pipeline, so we start with stages: and then define the first stage build. That stage has one job which consists of two steps:
Docker task (v2): build a Docker image based on the Dockerfile in the source code repository and push it to the container registry called ACR; ACR is a reference to a service connection defined in the project settings
PublishPipelineArtifact: the source code repository contains Kubernetes deployment manifests in YAML format in the manifests folder; the contents of that folder is published as a pipeline artifact, to be picked up in a later stage
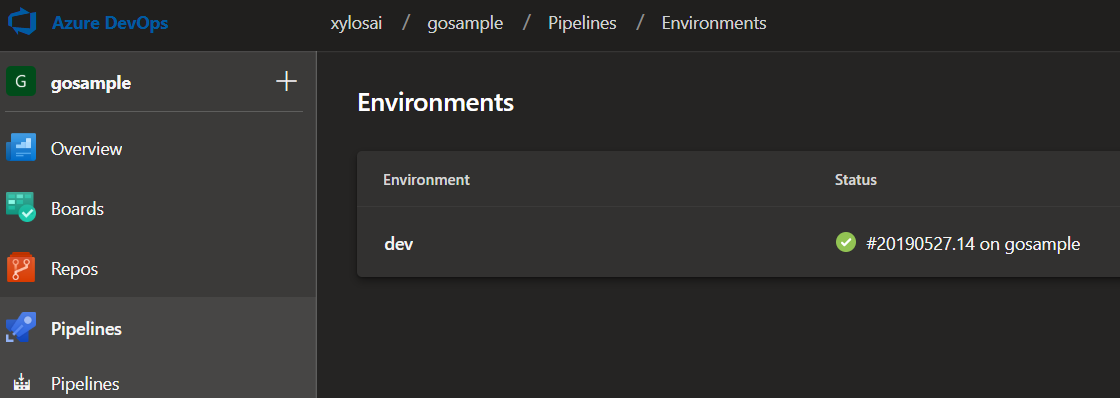
The second stage uses a deployment job (quite new; see this). In a deployment job, you can specify an environment to link to. In the above job, the environment is called dev. In Azure DevOps, the environment is shown as below:
dev environment
The environment functionality has Kubernetes integration which is pretty neat. You can drill down to the deployed objects such as deployments and services:
Kubernetes deployment in an Azure DevOps environment
The deployment has two tasks:
DownloadPipelineArtifact: download the artifact published in the first stage to $(System.ArtifactsDirectory)/manifests
KubernetesManifest: this task can deploy Kubernetes manifests; it uses an AKS service connection that was created during creation of the environment; a service account was created in a specific namespace and with access rights to that namespace only; the manifests property will look for an image name in the Kubernetes YAML files and append the tag which is the build id here
Note that the release stage will actually download the pipeline artifact automatically. The explicit DownloadPipelineArtifact task gives additional control over the download location.
The KubernetesManifest task is relatively new at the time of this writing (end of May 2019). Its image substitution functionality could be enough in many cases, without having to revert to Helm or manual text substitution tasks. There is more to this task than what I have described here. Check out the docs for more info.
Conclusion
If you are just starting out building CI/CD pipelines in YAML, you will probably have a hard time getting uses to the schema. I know I had! 😡 In the end though, doing it this way with the pipeline stored in source control will pay off in the long run. After some time, you will have built up a useful library of these pipelines to quickly get up and running in new projects. Recommended!!! 😉🚀🚀🚀
As explained on https://github.com/rancher/rio, Rancher Rio is a MicroPaaS that can be layered on top of any standard Kubernetes cluster. It makes it easier to deploy, scale, version and expose services. In this post, we will take a quick look at some of its basic capabilities.
To follow along, make sure you have a Kubernetes cluster running. I deployed a standard AKS cluster with three nodes. In your shell (I used Ubuntu Bash on Windows), install Rio:
curl -sfL https://get.rio.io | sh -
After installation, check the version of Rio with:
rio --version
rio version v0.1.1-rc1 (cdb75cf1)
With v0.1.1 there was an issue with deploying the registry component. v0.1.1-rc1 fixes that.
Make sure you have kubectl installed and that its context points to the cluster in which you want to deploy Rio. If that is the case, just run the following command:
rio install
The above command will install a bunch of components in the rio-system namespace. After a while, running kubectl get po -n rio-system should show the list below:
Rio installed
Rio will install Istio and expose a service mesh gateway via a service of type load balancer. With AKS, this will result in an Azure load balancer that sends traffic to the service mesh gateway. When you deploy Rio services, you can automatically get a DNS name that will resolve to the external IP of the Azure load balancer.
Let’s install such a Rio service. We will use the following application: https://github.com/gbaeke/realtime-go. Instead of the master branch, we will deploy the httponly branch. The repo contains a Dockerfile with a two-stage build that results in a web application that displays messages published to redis in real time. Before we deploy the application, deploy redis with the following command:
kubectl run redis --image redis --port 6379 --expose
Now deploy the realtime-go app with Rio:
rio run -p 8080/http -n realtime --build-branch httponly --env REDISHOST=redis:6379 https://github.com/gbaeke/realtime-go.git
Rio makes it easy to deploy the application because it will pull the specified branch of the git repo and build the container image based on the Dockerfile. The above command also sets an environment variable that is used by the realtime-go code to find the redis host.
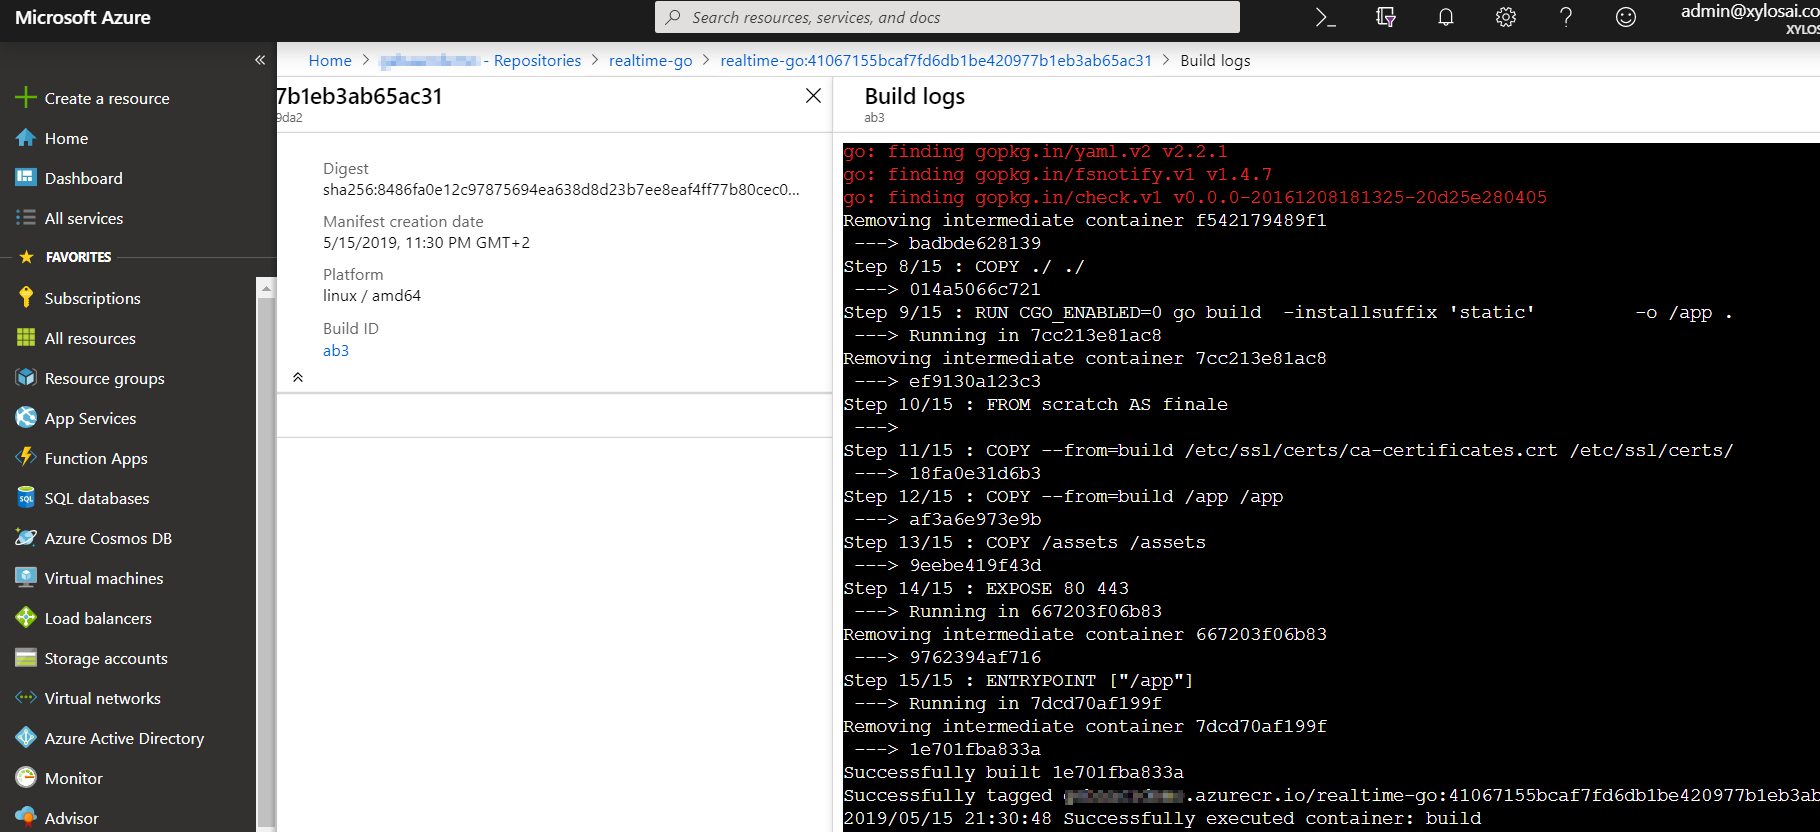
When the build is finished, the image is stored in the internal registry. You can check builds with rio builds. Get the build logs with rio build logsimagename. For example:
rio build logs default/realtime:7acdc6dfed59c1b93f2def1a84376a880aac9f5d
The result would be something like:
build logs
The rio run command results in a deployed service. Run rio ps to check this:
rio ps displays the deployed service
Notice that you also get a URL which is publicly accessible over SSL via a Let’s Encrypt certificate:
Application on public endpoint using a staging Let’s Encrypt cert
Just for fun, you can publish a message to the redis channel that this app checks for:
The above commands should display the message in the web app:
Great success!!!
To check the logs of the deployed service, run rio logs servicename. The result should be:
Logs from the realtime-go service
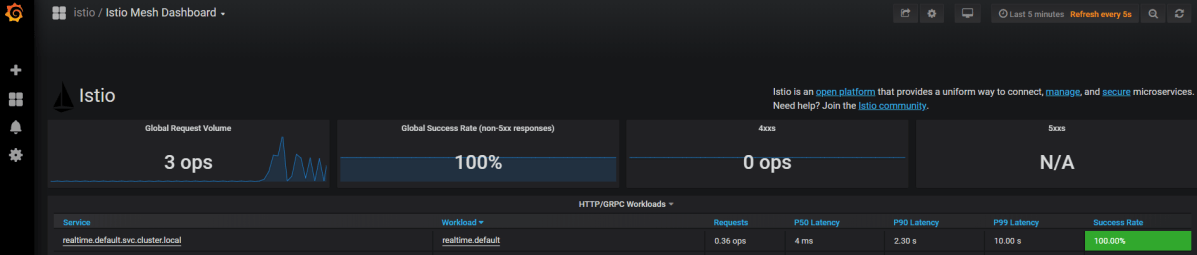
When you run rio –system ps you will see the rio system services. One of the services is Grafana, which contains Istio dashboards. Grab the URL of that service to access the dashboards:
One of the Istio dashboards
Even in this early version, Rio works quite well. It is very simple to install and it takes the grunt work out of deploying services on Kubernetes. Going from source code repository to a published service is just a single command, which is a bit similar to OpenShift. Highly recommended to give it a go when you have some time!
A longer time ago, I wrote a post about draft. Draft is a tool to streamline your Kubernetes development experience. It basically automates, based on your code, the creation of a container image, storing the image in a registry and installing a container based on that image using a Helm chart. Draft is meant to be used during the development process while you are still messing around with your code. It is not meant as a deployment mechanism in production.
The typical workflow is the following:
in the folder with your source files, run draft create
to build, push and install the container run draft up; in the background a Helm chart is used
to see the logs and connect to the app in your container over an SSH tunnel, run draft connect
modify your code and run draft up again
rinse and repeat…
Let’s take a look at how it works in a bit more detail, shall we?
Prerequisites
Naturally, you need a Kubernetes cluster with kubectl, the Kubernetes cli, configured to use that cluster.
Next, install Helm on your system and install Tiller, the server-side component of Helm on the cluster. Full installation instructions are here. If your cluster uses rbac, check out how to configure the proper service account and role binding. Run helm init to initialize Helm locally and install Tiller at the same time.
Now install draft on your system. Check out the quickstart for installation instructions. Run draftinit to initialize it.
Getting some source code
Let’s use a small Go program to play with draft. You can use the realtime-go repository. Clone it to your system and checkout the httponly branch:
You will need a redis server as a back-end for the realtime server. Let’s install that the quick and dirty way:
kubectl run redis --image=redis --replicas=1
kubectl expose deploy/redis –port 6379
Running draft create
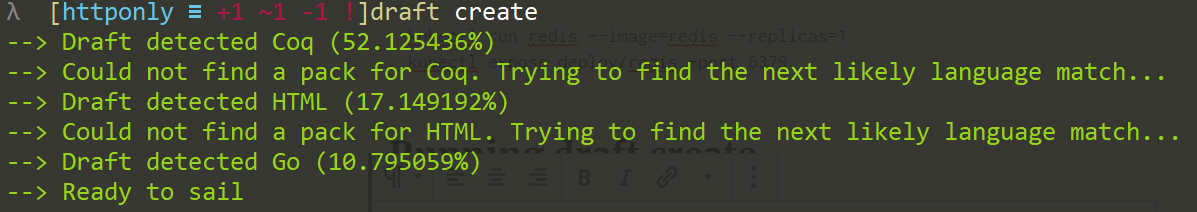
In the realtime-go folder, run draft create. You should get the following output:
draft create output
The command tries to detect the language and it found several. In this case, because there is no pack for Coq (what is that? 😉) and HTML, it used Go. Knowing the language, draft creates a simple Dockerfile if there is no such file in the folder:
FROM golang
ENV PORT 8080
EXPOSE 8080

WORKDIR /go/src/app
COPY . .

RUN go get -d -v ./...
RUN go install -v ./...

CMD ["app"]
Usually, I do not use the Dockerfile created by draft. If there already is a Dockerfile in the folder, draft will use that one. That’s what happened in our case because the folder contains a 2-stage Dockerfile.
Draft created some other files as well:
draft.toml: configuration file (more info); can be used to create environments like staging and production with different settings such as the Kubernetes namespace to deploy to or the Dockerfile to use
draft.tasks.toml: run commands before or after you deploy your container with draft (more info); we could have used this to install and remove the redis container
.draftignore: yes, to ignore stuff
Draft also created a charts folder that contains the Helm chart that draft will use to deploy your container. It can be modified to suit your particular needs as we will see later.
Helm charts folder and a partial view on the deployment.yaml file in the chart
Setting the container registry
In older versions of draft, the source files were compressed and sent to a sever-side component that created the container. At present though, the container is built locally and then pushed to a registry of your choice. If you want to use Azure Container Registry (ACR), run the following commands (set and login):
draft config set registry REGISTRYNAME.azurecr.io
az acr login -n REGISTRYNAME
Note that you need the Azure CLI for the last command. You also need to set the subscription to the one that contains the registry you reference.
With this configuration, you need Docker on your system. Docker will build and push the container. If you want to build in the cloud, you can use ACR Build Tasks. To do that, use these commands:
draft config set container-builder acrbuild
draft config set registry REGISTRYNAME.azurecr.io
draft config set resource-group-name RESOURCEGROUPNAME
Make sure your are logged in to the subscription (az login) and login to ACR as well before continuing. In this example, I used ACR build tasks.
Note: because ACR build tasks do not cache intermediate layers, this approach can lead to longer build times; when the image is small as in this case, doing a local build and push is preferred!
Running draft up
We are now ready to run draft up. Let’s do so and see what happens:
results of draft up
YES!!!! Draft built the container image and released it. Run helm ls to check the release. It did not have to push the image because it was built in ACR and pushed from there. Let’s check the ACR build logs in the portal (you can also use the draft logs command):
acr build log for the 2-stage Docker build
Fixing issues
Although the container is properly deployed (check it with helm ls), if you run kubectl get pods you will notice an error:
container error
In this case, the container errors out because it cannot find the redis host, which is a dependency. We can tell the container to look for redis via a REDISHOST environment variable. You can add it to deployment.yaml in the chart like so:
environment variable in deployment.yaml
After this change, just run draft up again and hope for the best!
Running draft connect
With the realtime-go container up and running, run draft connect:
output of draft connect
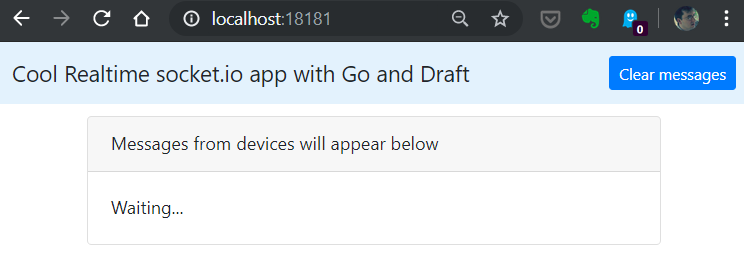
This maps a local port on your system to the remote port over an ssh tunnel. In addition, it streams the logs from the container. You can now connect to http://localhost:18181 (or whatever port you’ll get):
Great success! The app is running
If you want a public IP for your service, you can modify the Helm chart. In values.yaml, set service.type to LoadBalancer instead of ClusterIP and run draft up again. You can verify the external IP by running kubectl get svc.
Conclusion
Working with draft while your are working on one or more containers and still hacking away at your code really is smooth sailing. If you are not using it yet, give it a go and see if you like it. I bet you will!
Deploying Azure Kubernetes Service (AKS) is, like most other Kubernetes-as-a-service offerings such as those from DigitalOcean and Google, very straightforward. It’s either a few clicks in the portal or one or two command lines and you are finished.
Using these services properly and in a secure fashion is another matter though. I am often asked how to secure access to the cluster and its applications. In addition, customers also want visibility and control of incoming and outgoing traffic. Combining Azure Firewall with AKS is one way of achieving those objectives.
This post will take a look at the combination of Azure Firewall and AKS. It is inspired by this post by Dennis Zielke. In that post, Dennis provides all the necessary Azure CLI commands to get to the following setup:
In what follows, I will keep referring to the subnet names and IP addresses as in the above diagram.
Azure Firewall
Azure Firewall is a stateful firewall, provided as a service with built-in high availability. You deploy it in a subnet of a virtual network. The subnet should have the name AzureFirewallSubnet. The firewall will get two IP addresses:
Internal IP: the first IP address in the subnet (here 10.0.3.4)
Public IP: a public IP address; in the above setup we will use it to provide access to a Kubernetes Ingress controller via a DNAT rule
As in the physical world, you will need to instruct systems to route traffic through the firewall. In Azure, this is done via a route table. The following route table was created:
Route table
In (1) a route to 0.0.0.0/0 is defined that routes to the private IP of the firewall. The route will be used when no other route applies! The route table is associated with just the aks-5-subnet (2), which is the subnet where AKS (with advanced networking) is deployed. It’s important to note that now, all external traffic originating from the Kubernetes cluster passes through the firewall.
When you compare Azure Firewall to the Network Virtual Appliances (NVAs) from vendors such as CheckPoint, you will notice that the capabilities are somewhat limited. On the flip side though, Azure Firewall is super simple to deploy when compared with a highly available NVA setup.
Before we look at the firewall rules, let’s take a look at the Kubernetes Ingress Controller.
Kubernetes Ingress Controller
In this example, I will deploy nginx-ingress as an Ingress Controller. It will provide access to HTTP-based workloads running in the cluster and it can route to various workloads based on the URL. I will deploy the nginx-ingress with Helm.
Think of an nginx-ingress as a reverse proxy. It receives http requests, looks at the hostname and path (e.g. mydomain.com/api/user) and routes the request to the appropriate Kubernetes service (e.g. the user service).
Normally, the nginx-ingress service is accessed via an Azure external load balancer. Behind the scenes, this is the result of the service object having spec.type set to the value LoadBalancer. If we want external traffic to nginx-ingress to pass through the firewall, we will need to tell Kubernetes to create an internal load balancer via an annotation. Let’s do that with Helm. First, you will need to install tiller, the server-side component of Helm. Use the following procedure from the Microsoft documentation:
The second command installs nginx-ingress in the ingress namespace. The two –set parameters add the following annotations to the service object (yes I know, the Helm annotation parameters are ugly 🤢):
This ensures an internal load balancer gets created. It gets created in the mc-* resource group that backs your AKS deployment:
Internal load balancer created by the Kubernetes cloud integration components
Note that Kubernetes creates the load balancer, including the rules and probes for port 80 and 443 as defined in the service object that comes with the Helm chart. The load balancer is created in the ing-4-subnet as instructed by the service annotation. Its private IP address is 10.0.4.4 as in the diagram at the top of this post
DNAT Rule to Load Balancer
To provide access to internal resources, Azure Firewall uses DNAT rules which stands for destination network address translation. The concept is simple: traffic to the firewall’s public IP on some port can be forwarded to an internal IP on the same or another port. In our case, traffic to the firewall’s public IP on port 80 and 443 is forwarded to the internal load balancer’s private IP on port 80 and 443. The load balancer will forward the request to nginx-ingress:
DNAT rule forwarding port 80 and 443 traffic to the internal load balancer
If the installation of nginx-ingress was successful, you should end up at the default back-end when you go to http://firewallPublicIP.
nginx-ingress default backend when browsing to public IP of firewall
If you configured Log Analytics and installed the Azure Firewall solution, you can look at the firewall logs. DNAT actions are logged and can be inspected:
Firewall logs via Log Analytics
Application and Network Rules
Azure Firewall application rules are rules that allow or deny outgoing HTTP/HTTPS traffic based on the URL. The following rules were defined:
Application rules
The above rules allow http and https traffic to destinations such as docker.io, cloudflare and more.
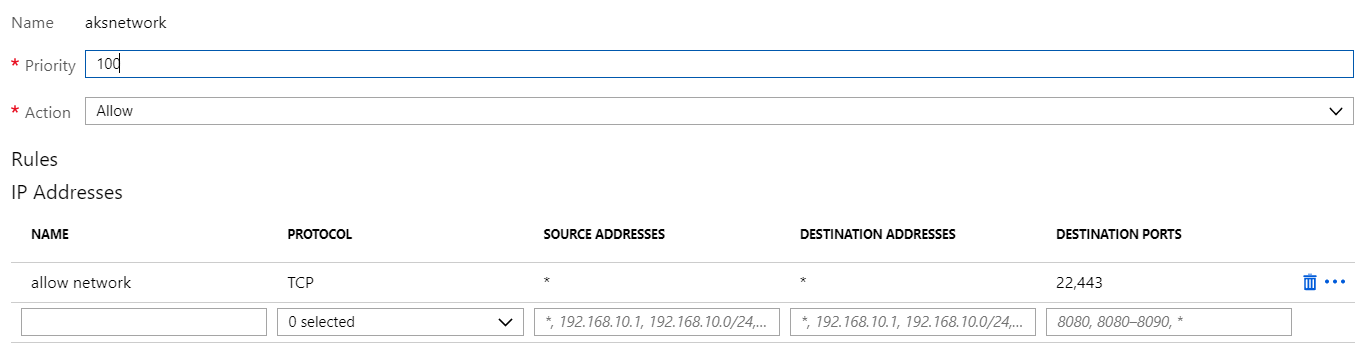
Note that another Azure Firewall rule type, network rules, are evaluated first. If a match is found, rule evaluation is stopped. Suppose you have these network rules:
Network rules
The above network rule allows port 22 and 443 for all sources and destinations. This means that Kubernetes can actually connect to any https-enabled site on the default port, regardless of the defined application rules. See rule processing for more information.
Threat Intelligence
This feature alerts on and/or denies network traffic coming from known bad IP addresses or domains. You can track this via Log Analytics:
Threat Intelligence Alerts and Denies on Azure Firewall
Above, you see denied port scans, traffic from botnets or brute force credentials attacks all being blocked by Azure Firewall. This feature is currently in preview.
Best Practices
The AKS documentation has a best practices section that discusses networking. It contains useful information about the networking model (Kubenet vs Azure CNI), ingresses and WAF. It does not, at this point in time (May 2019), desicribe how to use Azure Firewall with AKS. It would be great if that were added in the near future.
Here are a couple of key points to think about:
WAF (Web Application Firewall): Azure Firewall threat intelligence is not WAF; to enable WAF, there are several options:
you can use cloud-native WAFs such as TwistLock (WAF is one of the features of this product; it also provides firewall and vulnerability assessment)
remote access to Kubernetes API: today, the API server is exposed via a public IP address; having the API server on a local IP will be available soon
remote access to Kubernetes hosts using SSH: only allow SSH on the private IP addresses; use a bastion host to enable connectivity
Conclusion
Azure Kubernetes Service (AKS) can be combined with Azure Firewall to control network traffic to and from your Kubernetes cluster. Log Analytics provides the dashboard and logs to report and alert on traffic patterns. Features such as threat intelligence provide an extra layer of defense. For HTTP/HTTPS workloads (so most workloads), you should complement the deployment with a WAF such as Azure Application Gateway or 3rd party.
Several years ago, when we started our first adventures in the wonderful world of IoT, we created an application for visualizing real-time streams of sensor data. The sensor data came from custom-built devices that used 2G for connectivity. IoT networks and protocols such as SigFox, NB-IoT or Lora were not mainstream at that time. We leveraged what were then new and often preview-level Azure services such as IoT Hub, Stream Analytics, etc… The architecture was loosely based on lambda architecture with a hot and cold path and stateful window-based stream processing. Fun stuff!
Kubernetes already existed but had not taken off yet. Managed Kubernetes services such as Azure Kubernetes Service (AKS) weren’t a thing.
The application (end-user UI and management) was loosely based on a micro-services pattern and we decided to run the services as Docker containers. At that time, Karim Vaes, now a Program Manager for Azure Storage, worked at our company and was very enthusiastic about Rancher. , Rancher was still v1 and we decided to use it in combination with their own container orchestration framework called Cattle.
Our experience with Rancher was very positive. It was easy to deploy and run in production. The combination of GitHub, Shippable and the Rancher CLI made it extremely easy to deploy our code. Rancher, including Cattle, was very stable for our needs.
In recent years though, the growth of Kubernetes as a container orchestrator platform has far outpaced the others. Using an alternative orchestrator such as Cattle made less sense. Rancher 2.0 is now built around Kubernetes but maintains the same experience as earlier versions such as simple deployment and flexible configuration and management.
In this post, I will look at deploying Rancher 2.0 and importing an existing AKS cluster. This is a basic scenario but it allows you to get a feel for how it works. Indeed, besides deploying your cluster with Rancher from scratch (even on-premises on VMware), you can import existing Kubernetes clusters including managed clusters from Google, Amazon and Azure.
Installing Rancher
For evaluation purposes, it is best to just run Rancher on a single machine. I deployed an Azure virtual machine with the following properties:
Operating system: Ubuntu 16.04 LTS
Size: DS2v3 (2 vCPUs, 8GB of RAM)
Public IP with open ports 22, 80 and 443
DNS name: somename.westeurope.cloudapp.azure.com
In my personal DNS zone on CloudFlare, I created a CNAME record for the above DNS name. Later, when you install Rancher you can use the custom DNS name in combination with Let’s Encrypt support.
On the virtual machine, install Docker. Use the guide here. You can use the convenience script as a quick way to install Docker.
With Docker installed, install Rancher with the following command:
More details about the single node installation can be found here. Note that Rancher uses etcd as a datastore. With the command above, the data will be in /var/lib/rancher inside the container. This is ok if you are just doing a test drive. In other cases, use external storage and mount it on /var/lib/rancher.
A single-node install is great for test and development. For production, use the HA install. This will actually run Rancher on Kubernetes. Rancher recommends a dedicated cluster in this scenario.
After installation, just connect https://your-custom-domain and provide a password for the default admin user.
Adding a cluster
To get started, I added an existing three-node AKS cluster to Rancher. After you add the cluster and turn on monitoring, you will see the following screen when you navigate to Clusters and select the imported cluster:
Dashboard for a cluster
To demonstrate the functionality, I deployed a 3-node cluster (1.11.9) with RBAC enabled and standard networking. After deployment, open up Azure Cloud shell and get your credentials:
az aks list -o table
az aks get-credentials -n cluster-name -g cluster-resource-group
kubectl cluster-info
The first command lists the clusters in your subscription, including their name and resource group. The second command configures kubectl, the Kubernetes command line admin tool, which is pre-installed in Azure Cloud Shell. To verify you are connected, the last command simply displays cluster information.
Now that the cluster is deployed, let’s try to import it. In Rancher, navigate to Global – Clusters and click Add Cluster:
Add cluster via Import
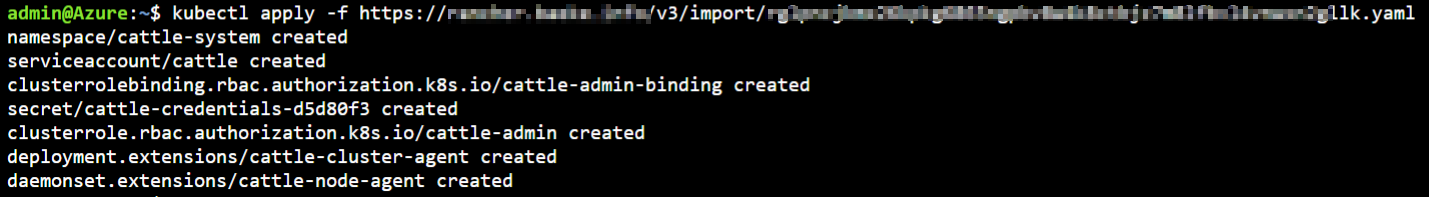
Click Import, type a name and click Create. You will get a screen with a command to run:
Running the command to prepare the cluster for import
Continue on in Rancher, the cluster will be added (by the components you deployed above):
Cluster appears in the list
Click on the cluster:
Top of the cluster dashboard
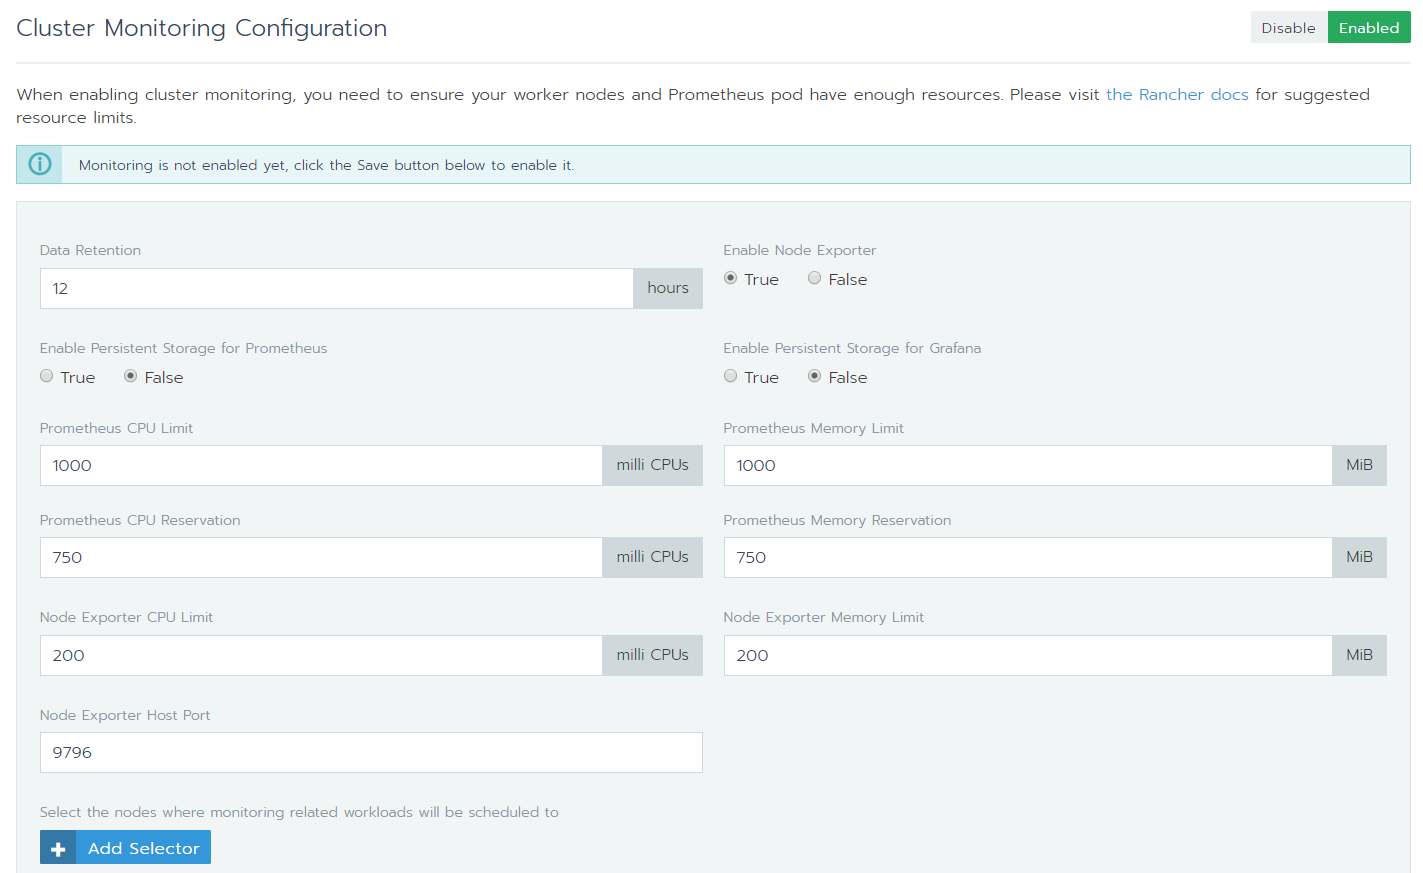
To see live metrics, you can click Enable Monitoring. This will install and configure Prometheus and Grafana. You can control several parameters of the deployment such as data retention:
Enabling monitoring
Notice that by default, persistent storage for Grafana and Prometheus is not configured.
Note: with monitoring enabled or not, you will notice the following error in the dashboard:
Controller manager and scheduler unhealthy?
The error is described here. In short, the components are probably healthy. The error is not related to a Rancher issue but an upstream Kubernetes issue.
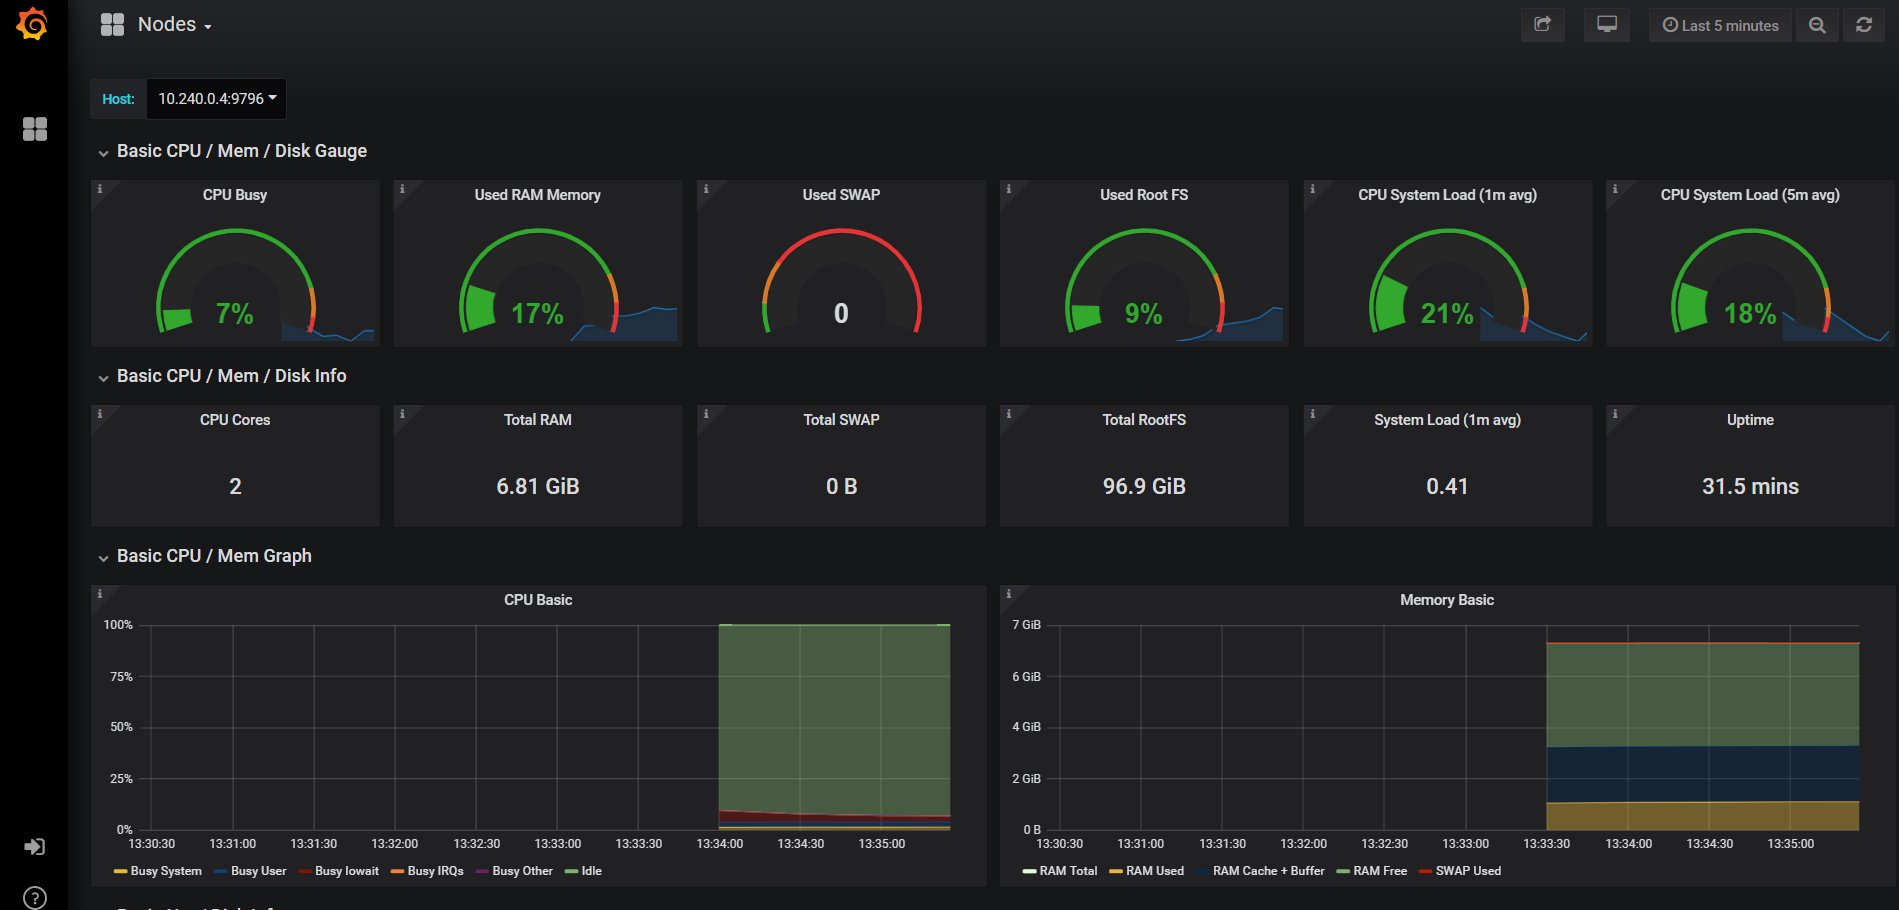
When the monitoring API is ready, you will see live metrics and Grafana icons. Clicking on the Graphana icon next to Nodes gives you this:
Node monitoring with Prometheus and Grafana
Of course, Azure provides Container Insights for monitoring. The Grafana dashboards are richer though. On the other hand, querying and alerting on logs and metrics from Container Insights is powerful as well. You can of course enable them all and use the best of both worlds.
Conclusion
We briefly looked at Rancher 2.0 and how it can interact with a existing AKS cluster. An existing cluster is easy to add. Once it is added, adding monitoring is “easy peasy lemon squeezy” as my daughter would call it! 😉 As with Rancher 1.x, I am again pleasantly surprised at how Rancher is able to make complex matters simpler and more fun to work with. There is much more to explore and do of course. That’s for some follow-up posts!